The emergence of the global pandemic COVID-19 in the first quarter of 2020 caused severe economic and market shocks. In an unprecedented move, federal, state and local governments purposely shut down economic activity to prevent the spread of the virus. Everything from restaurants to theme parks to manufacturing plants closed, and people holed up in their homes. The world as we knew it stopped.
2020: A Turbulent Year for Markets
When federal, state and local officials initiated restrictions in mid-March to address the COVID-19 outbreak, markets reacted swiftly to the negative economic impact. Investors sought liquidity by closing out positions resulting in price pressure and asymmetric movements in the fixed income markets and dramatic price declines and volatility spikes in the equities markets. Equities closed the first quarter with their worst performance since the financial crisis. Additionally, volatility, as measured by the CBOE Volatility Index (VIX), elevated to historic highs. From a market structure perspective, markets remained open and functioning. The financial system and market infrastructure have been extraordinarily resilient, withstanding record high volumes and volatility.In response to extreme market volatility in March, the Federal Reserve, Treasury Department and Congress implemented an unprecedented number of programs to support liquidity in various fixed income markets, coupled with fiscal stimulus. The Fed vowed (and continues to vow) to use all of its tools to maintain market liquidity and help the economic recovery. This bolstered investor sentiment in the equities markets, creating the Fed floor.
To date, volatility has settled, albeit still elevated to historical levels. Volumes in both equities and multi-listed options remain around 50% higher than normal levels. Much of this is attributed to the boom in retail investing.
The portion of retail investing of total equities volumes is now estimated at 25%, versus around 10% historically.
In multi-listed options volumes, around 50% of the growth in volumes this year is attributed to retail investors. While the sustainability of these retail volumes is still under debate, they made a significant contribution to the
2020 journey for volumes.
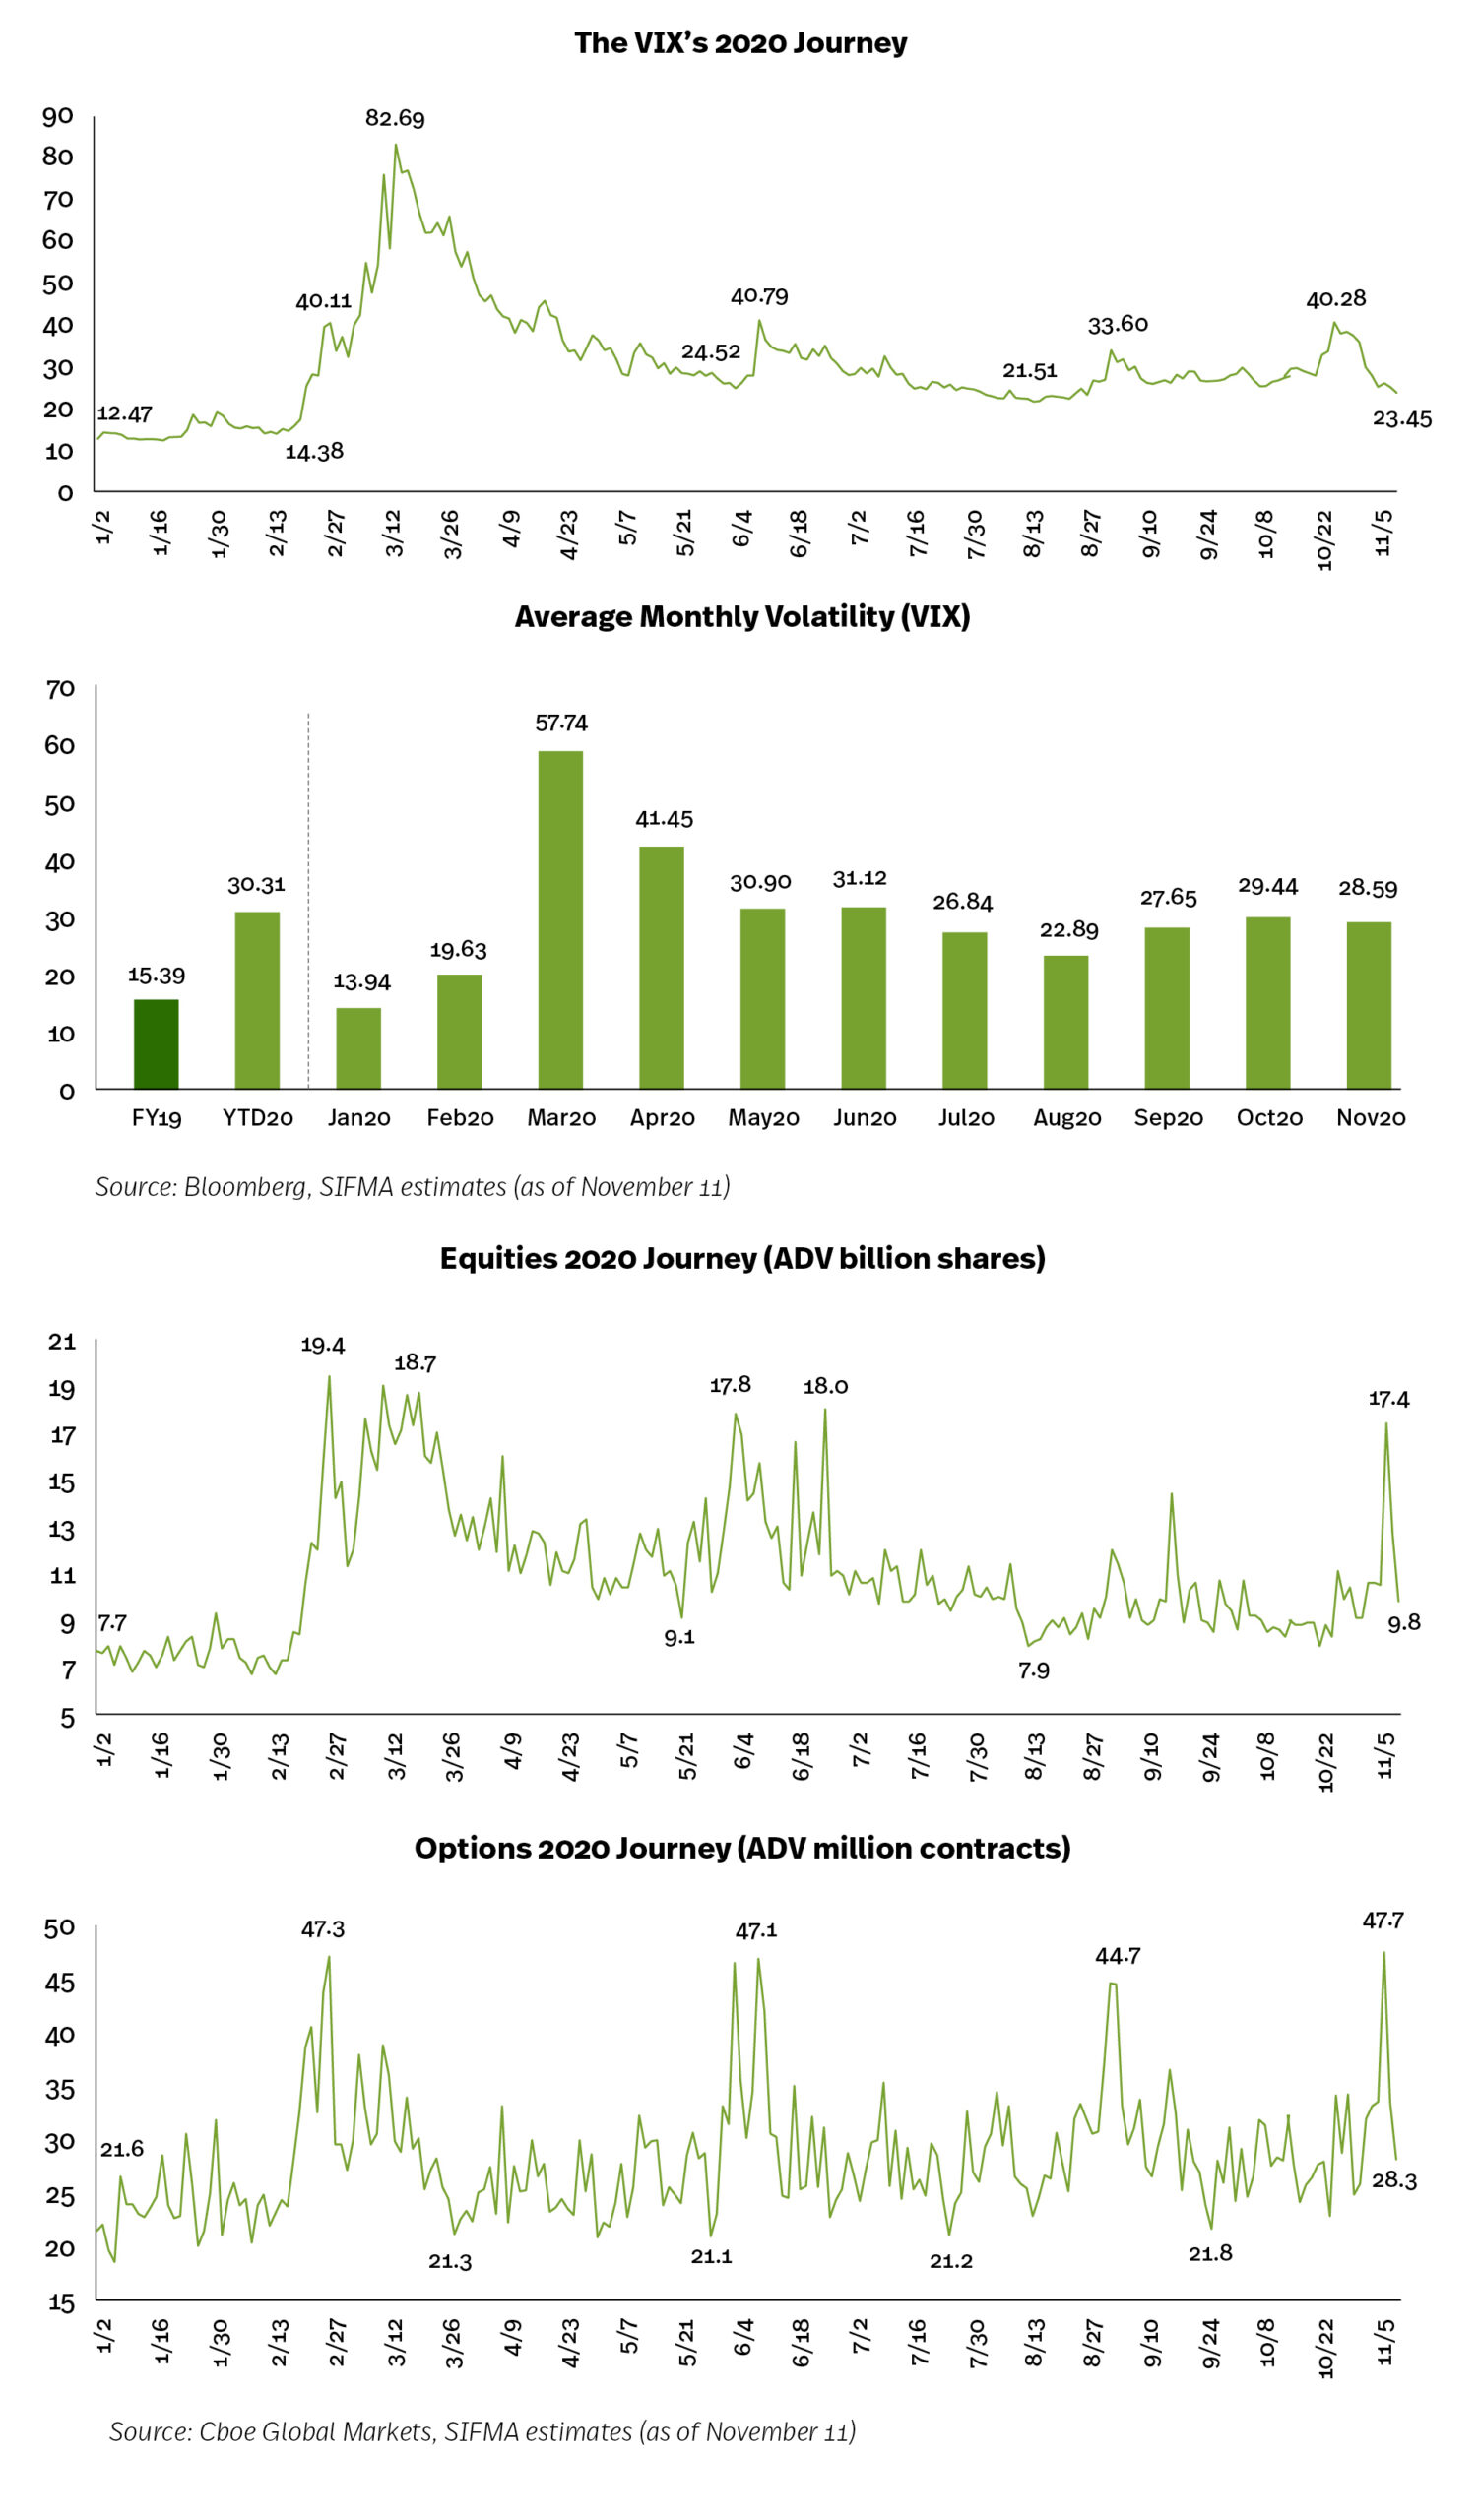
We highlight the following market metrics (as of November 11):
- Volatility (VIX): YTD average 30.31, +97.0% to FY19 average of 15.39 but -63.3% to the peak of 82.69
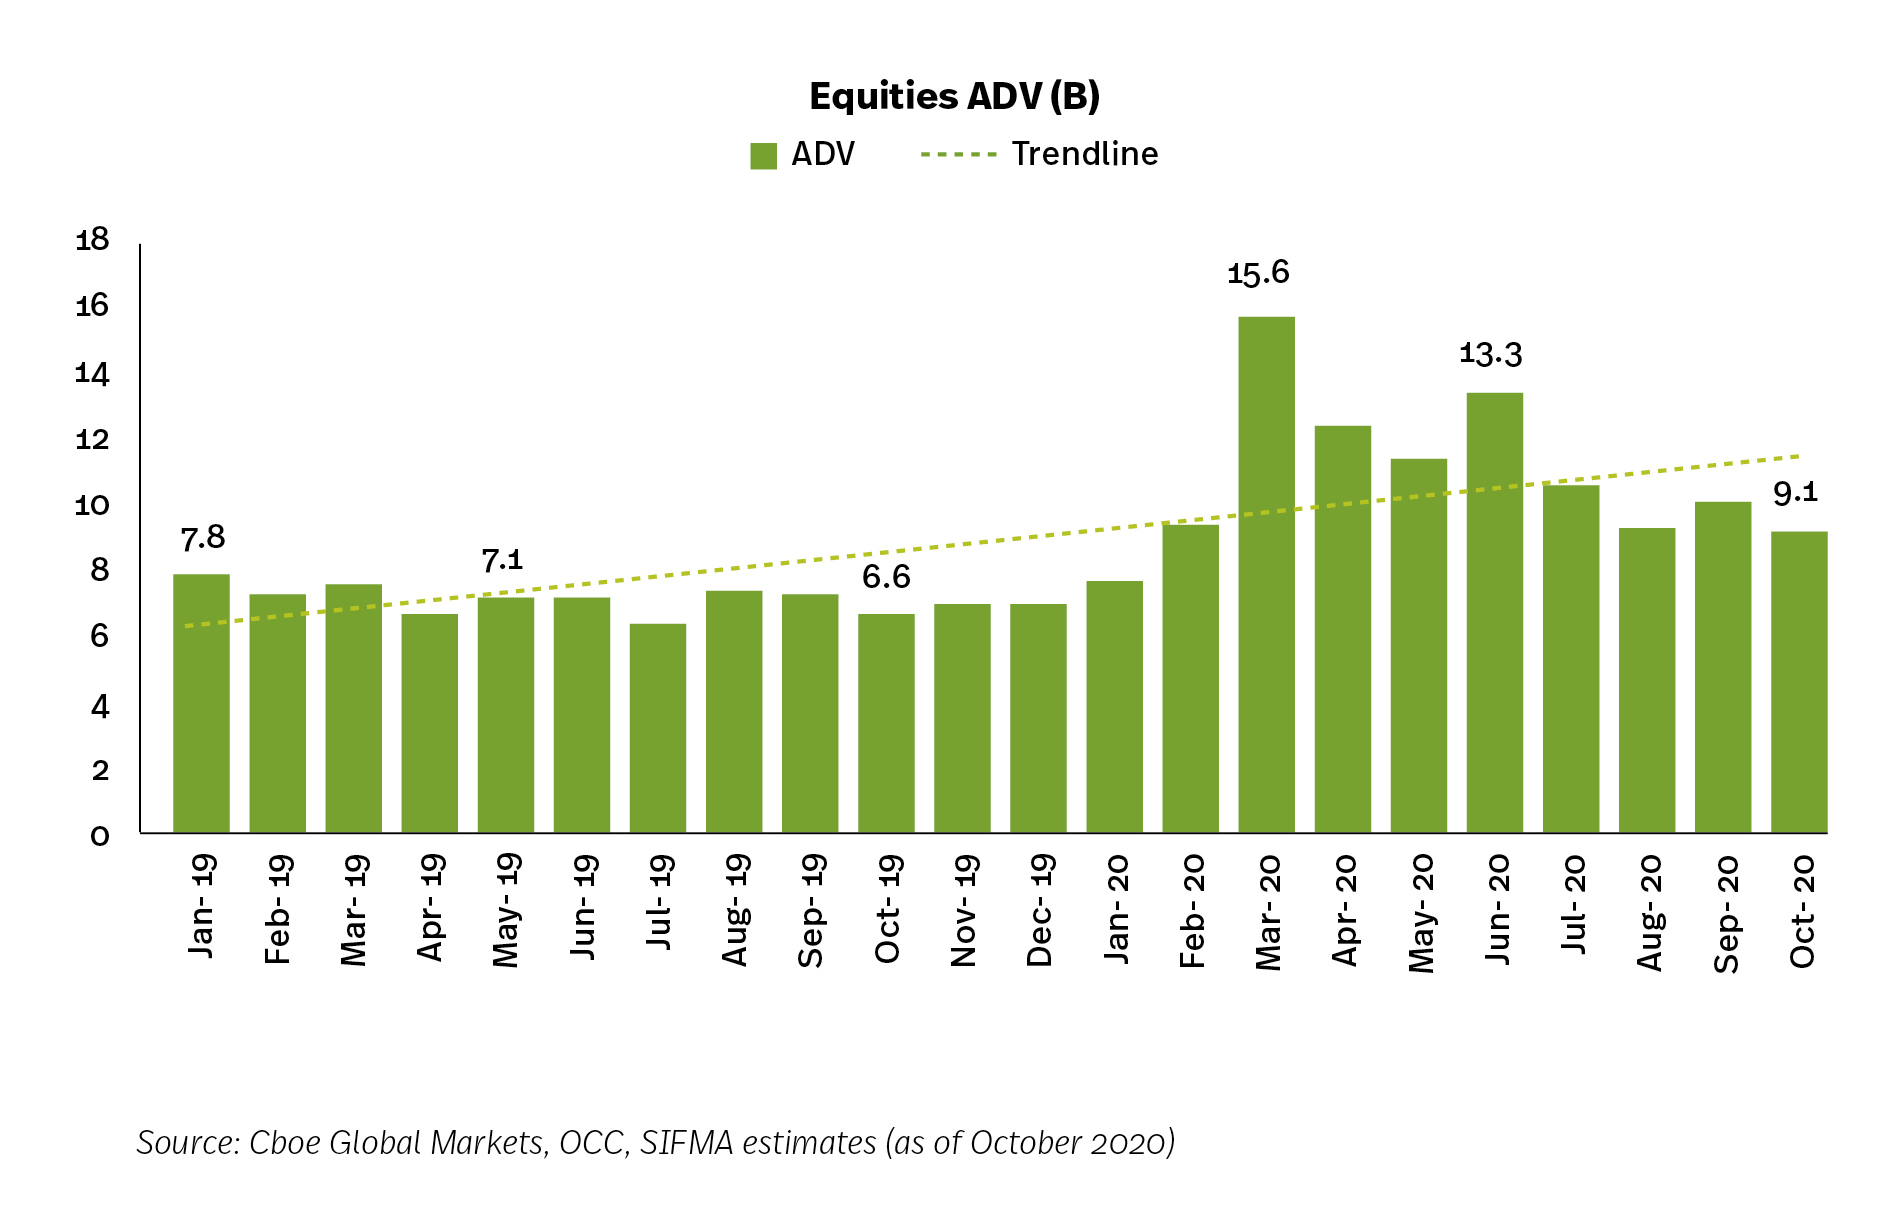
- Equity ADV: YTD 10.9 billion shares, +54.9% to FY19 average of 7.0 billion shares but -43.7% to the peak of 19.4 billion shares
- Options ADV: YTD 28.3 million contracts, +48.7% to FY19 average of 19.1 million contracts but -40.7% to the peak of 47.7 million contracts
- Market Performance (versus the March trough): S&P 500 +59.7%; Dow Jones +58.1%; Nasdaq +71.8%; and Russell 2000 +75.2%
Equities Issuance & Market Cap
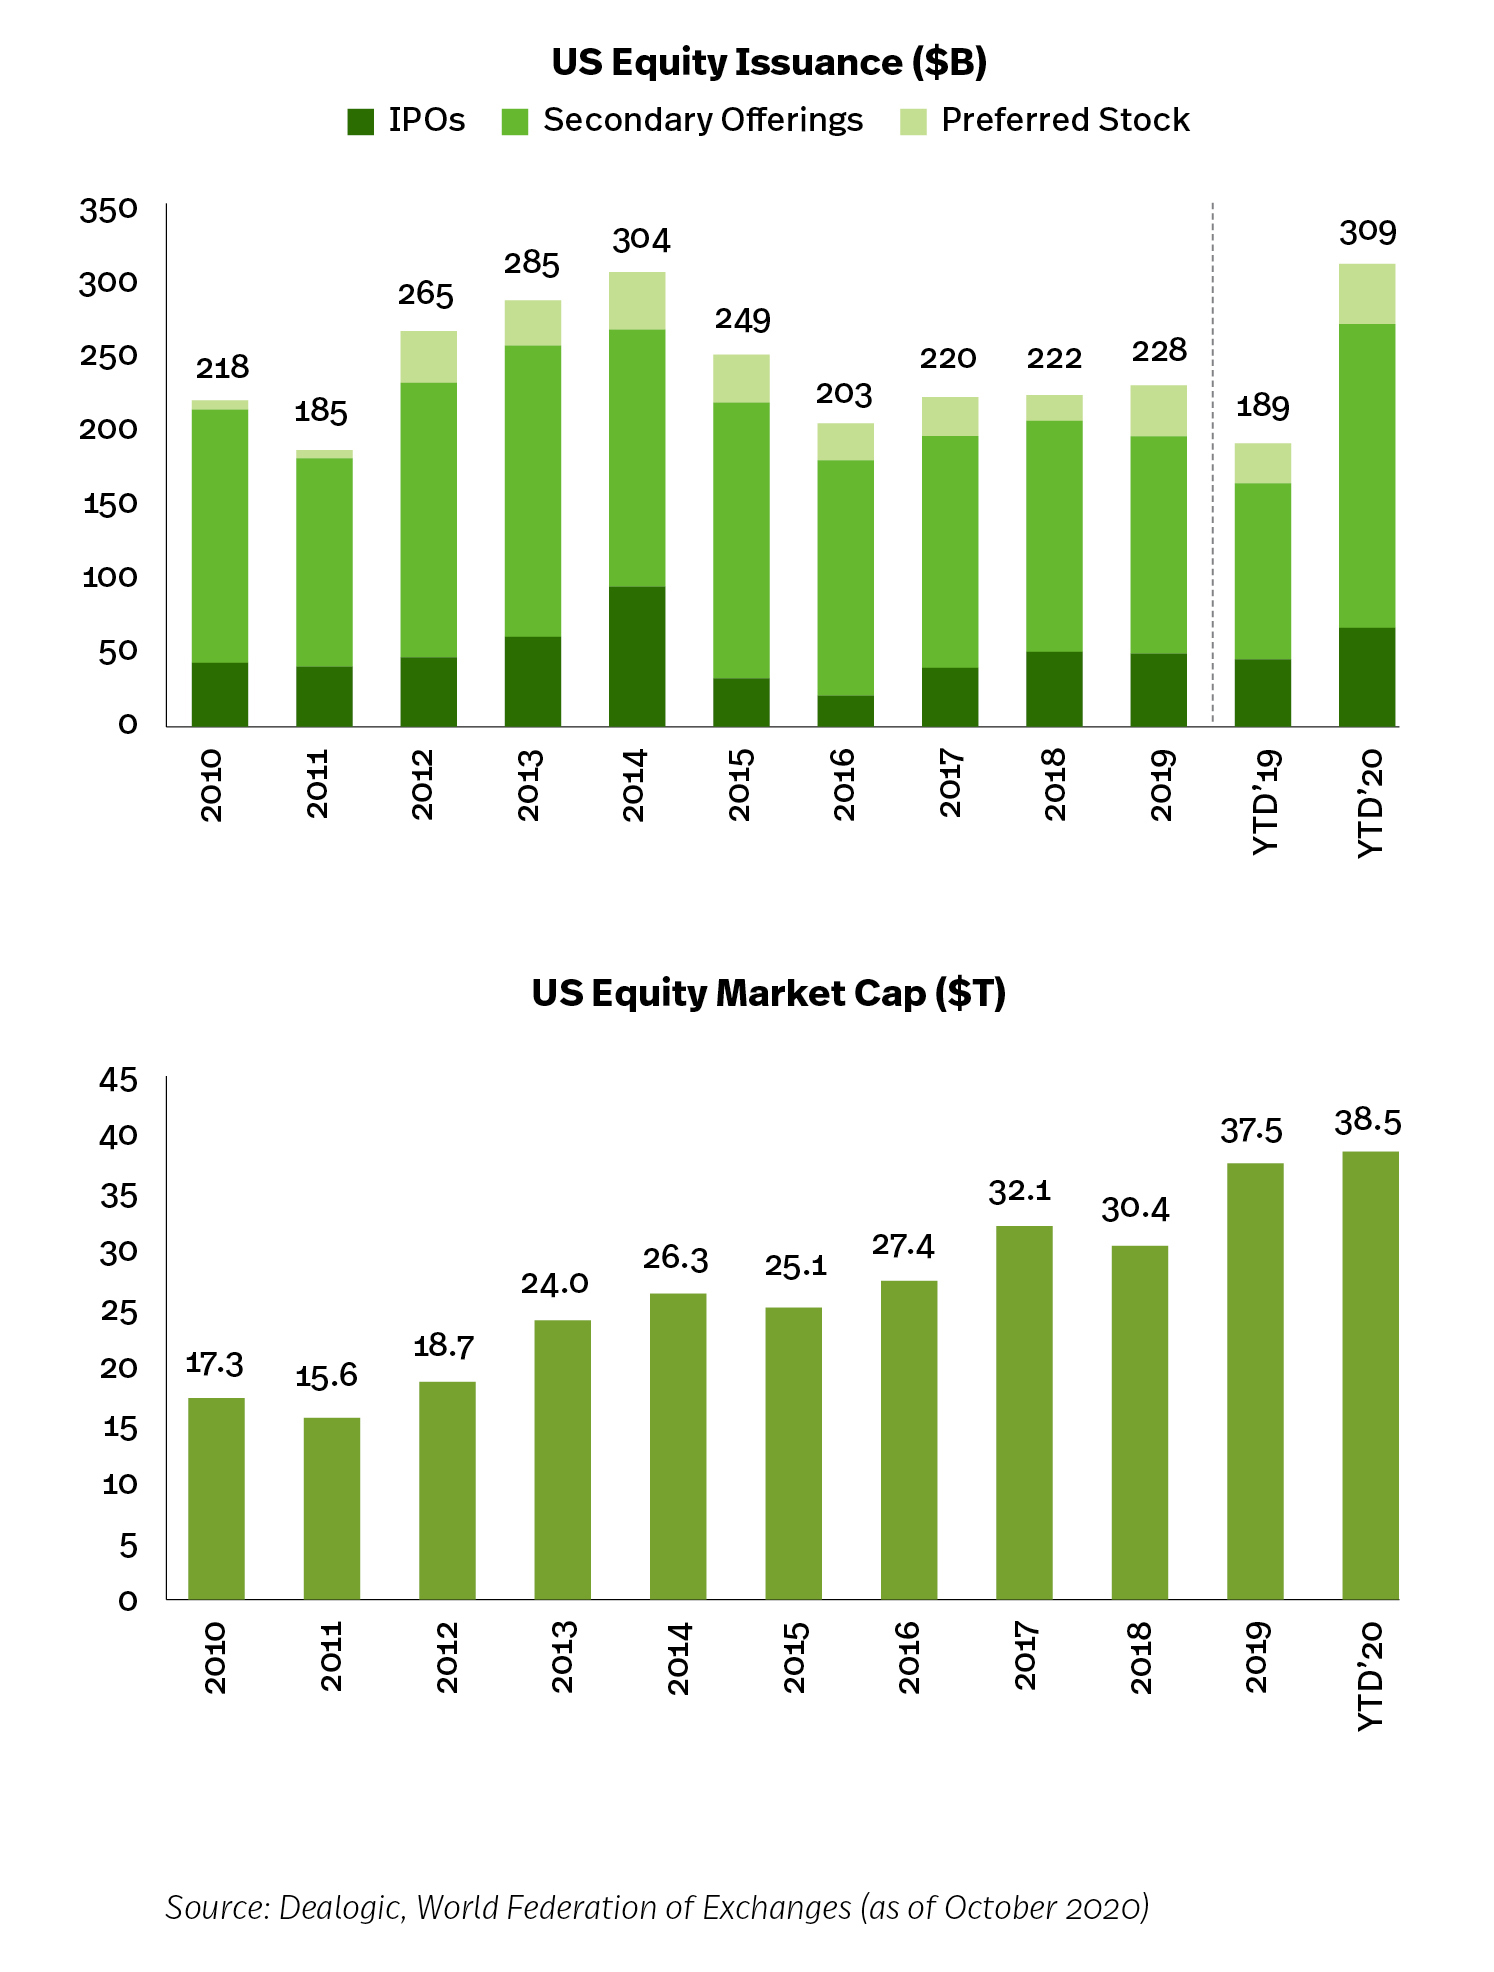
Issuance: Total U.S. equity issuance was $228 billion in 2019, essentially flat Y/Y, and $309 billion YTD 2020 (through October), +63.4% Y/Y. IPOs totaled $49 billion in 2019, -2.1% Y/Y, and $66 billion YTD (through October), +46.9% Y/Y. Total issuance has declined at a -5.6% CAGR over the last five years, with IPOs experiencing a -12.2% CAGR.Market Cap: Total U.S. equity market cap was $37.5 billion in 2019, +23.1% Y/Y, and $38 billion YTD (through October), +8.8% Y/Y. Market cap has grown at a +7.3% CAGR over the last five years.
Fixed Income Issuance & Outstanding
Issuance: Total fixed income issuance was $8.2 trillion in 2019, +10.1Y/Y, and $9.9 trillion YTD 2020 (through October), +46.3% Y/Y. Issuance has increased at a +5.0% CAGR over the last five years.Outstanding: Total fixed income outstanding was $44.9 trillion in 2019, +4.7% Y/Y, and $49.6 trillion YTD 2020 (through October), +13.2% Y/Y. Outstanding has grown at a +3.6% CAGR over the last five years.

Equities, Options & ETF Market Volumes
Investors in U.S. markets continue to enjoy narrow spreads, low transaction costs and fast execution speeds. There is also plenty of opportunity for price improvement, especially for retail investors.In this unusual year (through October), 10.9 billion shares traded on U.S. equity markets every day. This is compared to around 7.4 billion shares historically, +46.7%. ADV averaged 10.2 billion shares and 8.8 billion shares for the last 12 to 24 months, while the six month average was 10.6 billion shares.
U.S. multi-listed options are also experiencing a record year (through October), with YTD ADV 28.6 million contracts, +47.4% Y/Y. This is compared to around 16.7 million contracts historically, +71.3%. ADV averaged 27.2 million contracts and 23.5 million contracts for the last 12 to 24 months, while the six month average was 29.3 million contracts.
ETF ADV was 2.1 billion shares (through October), +47.8% Y/Y. This is compared to around 1.4 billion shares historically, +54.2%. ADV averaged 1.9 billion shares and 1.7 billion shares for the last 12 to 24 months, while the six month average was 1.7 billion shares.
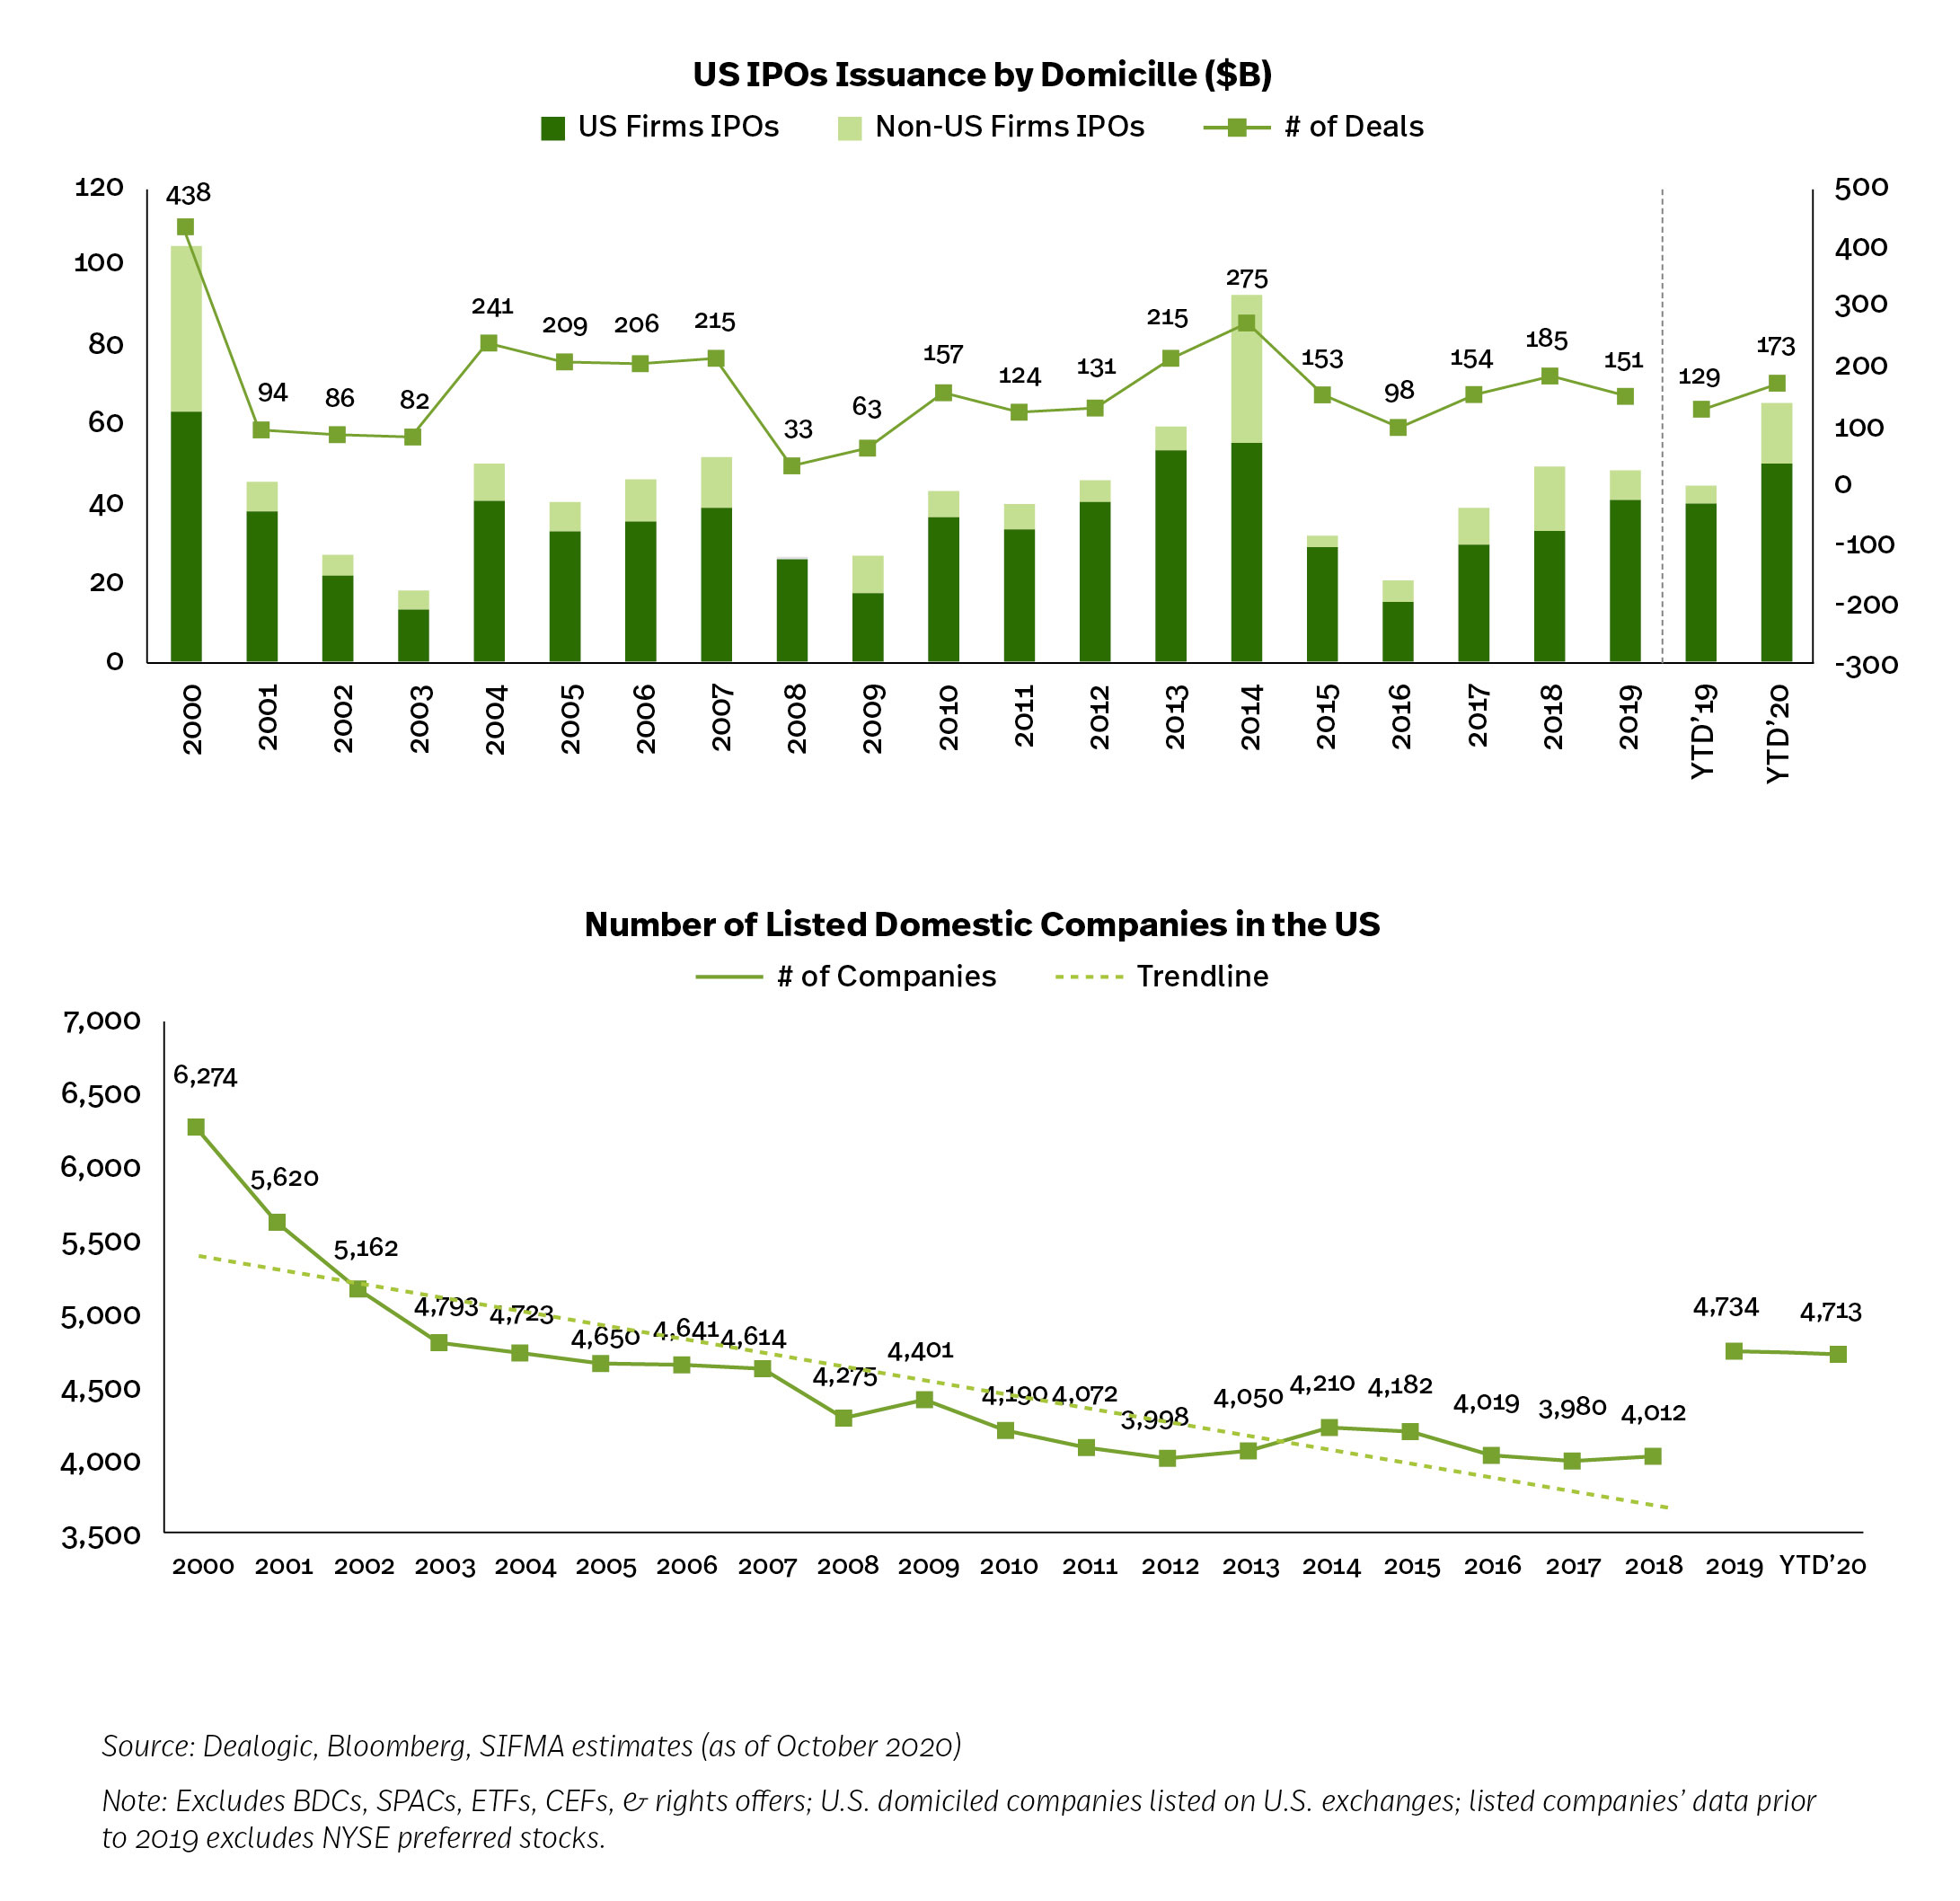
Capital Formation
As of October 2020, IPOs totaled $66.0 billion, +46.9% Y/Y. Of this, $50.5 billion, or 76.5% of the total, was in U.S. domiciled firms, -13.2 pps Y/Y. The number of deals was 173 YTD, +34.1% Y/Y; U.S. domiciled deals was 130, +28.7% Y/Y.The number of listed domestic companies was 5,153, down 25.5% since 2000 (6,917) but up 25.6% from the 2012 low (4,102).
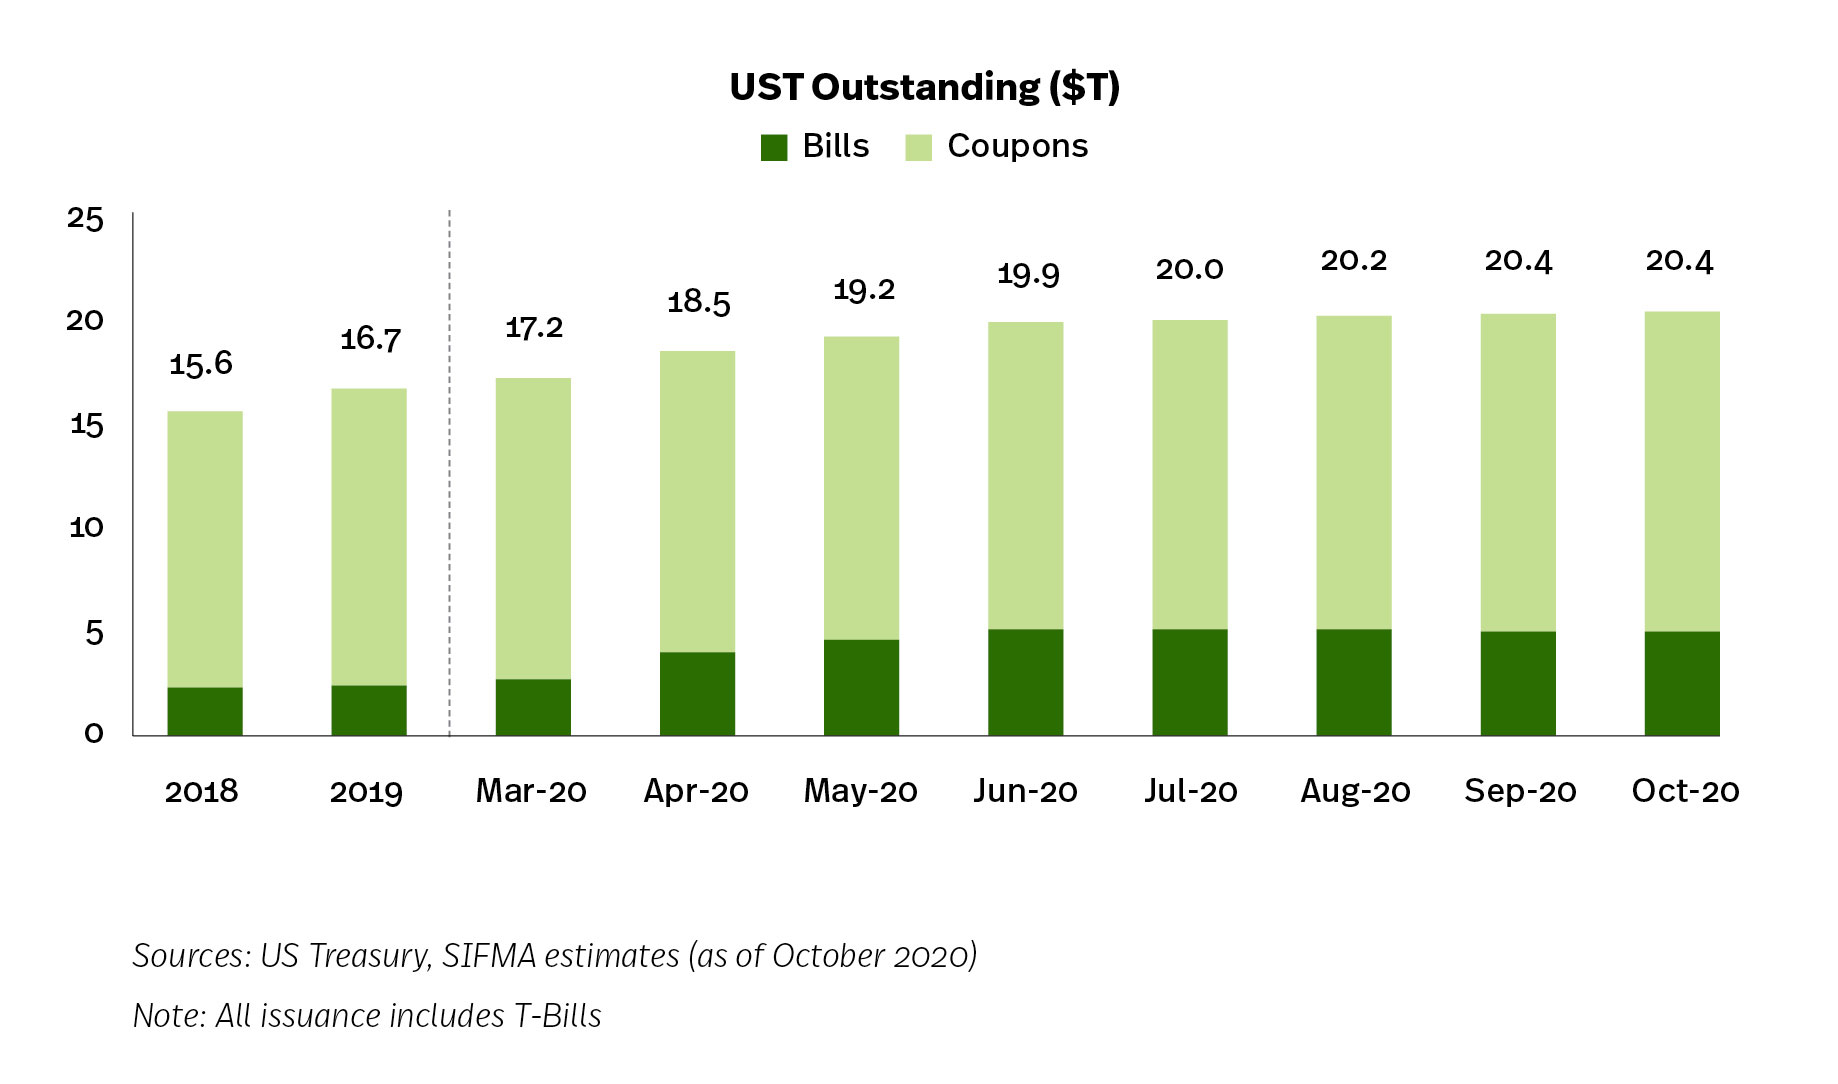
UST Issuance to Fund COVID-19 Stimulus
While the Fed liquidity programs, with the assistance of the Treasury, helped calm market turmoil, the government will eventually need to pay for these programs and the substantial fiscal stimulus that Congress has mandated (~$3 trillion). Expectations are that Treasury will have to continue upping the size of its borrowings in both the short and the long term to fund the market programs.As of October 2020, there was $20.4 trillion in UST outstanding, +22.6% to the end of 2019. The increase is driven by issuance of bills, +106.3% since 2019, followed by a 13.4% increase in bonds and 8.1% increase in notes.
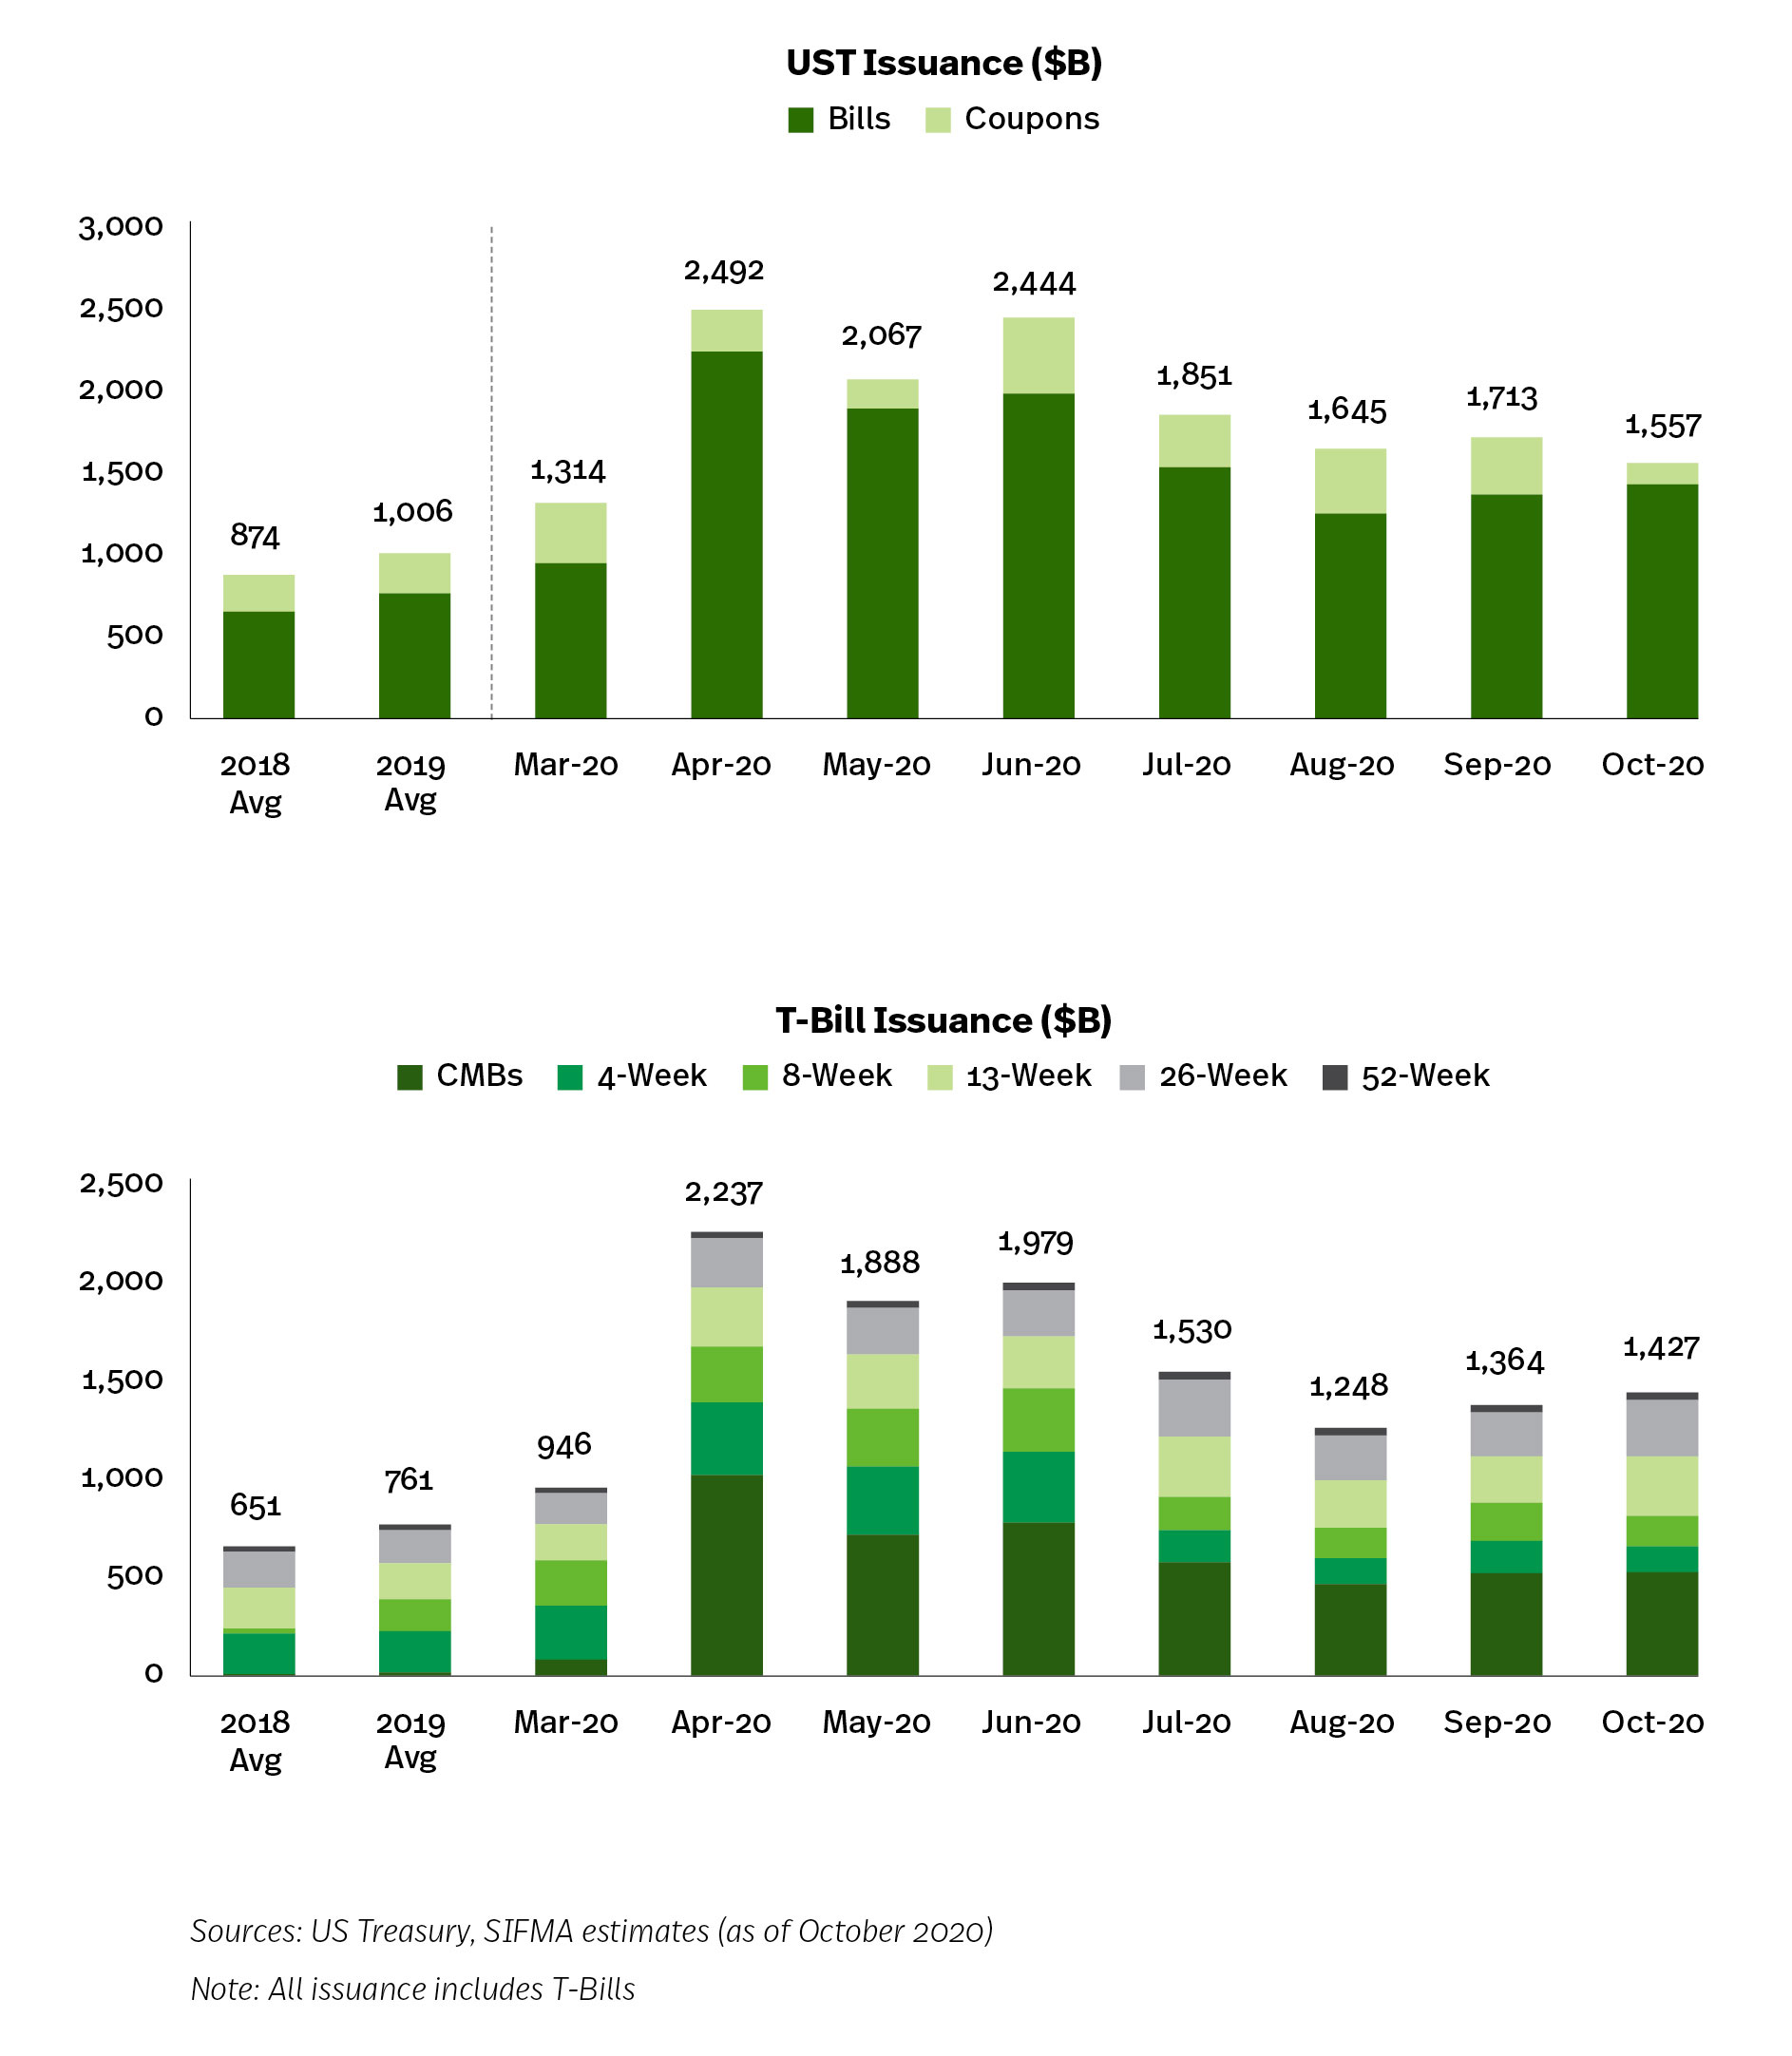
UST issuance YTD (through October) was $17.1 trillion, +69.5% Y/Y. Funding for the Fed programs and stimulus is driven by T-Bills, specifically cash management balances (CMB). T-Bill issuance YTD (through October) was $14.2 trillion, +85.9% Y/Y. CMB represent 33.1% of this total, at $4.7 trillion, +29.8x Y/Y.
LIBOR Transition Update
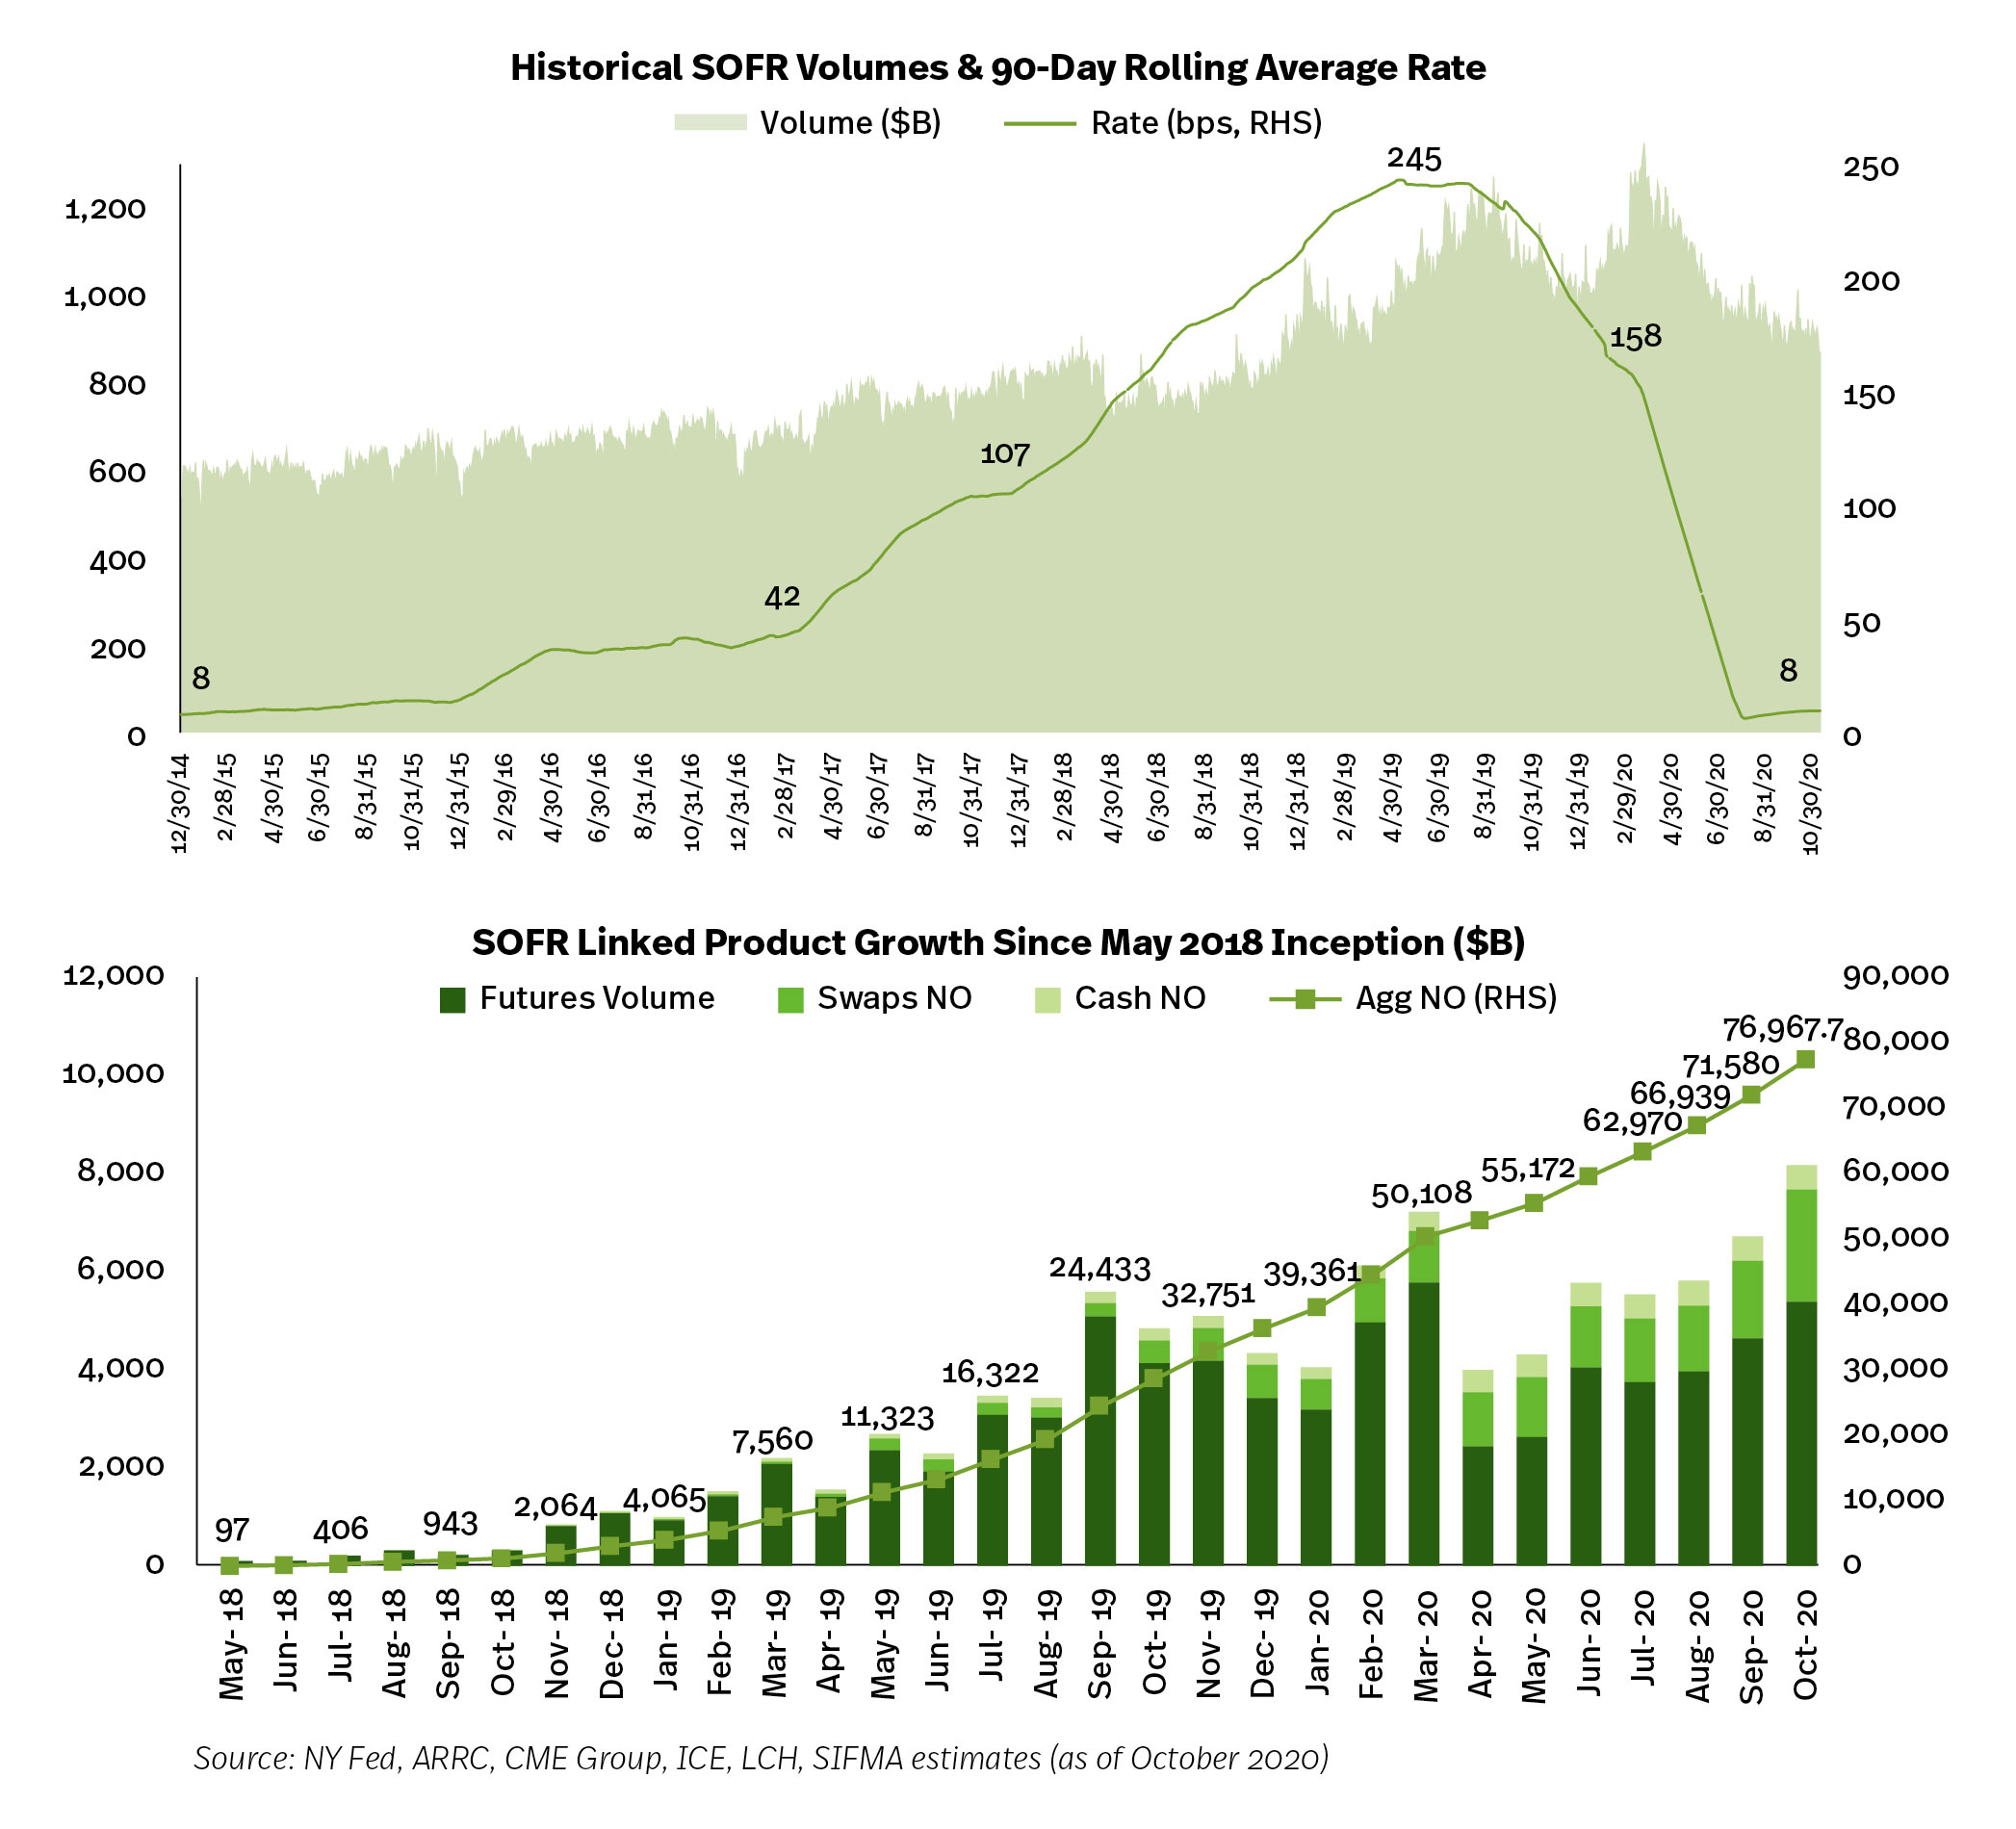
The transition from the London Interbank Offered Rate (LIBOR) to alternative interest rate benchmarks is well underway, but much work remains1. In the U.S., the Alternative Reference Rates Committee (ARRC) is leading the transition away from LIBOR to the Secured Overnight Financing Rate (SOFR).SOFR is based on the overnight repo markets, moving the reference rate from being based on ~$1 billion transactions per day (the most active tenor of LIBOR, three months) to the repo market with around $1 trillion transactions per day. Publication of the SOFR rate began in April 2018. Trading and clearing of SOFR-based swaps and futures began in May 2018.
As of October 30, the SOFR rate was 9.1 bps (90 day rolling average). Fed data puts volumes at $873 billion. Market volumes stand at $5.4 trillion for futures contracts, with an aggregate notional outstanding of $77.0 trillion for all SOFR related products.
Private Wealth Management
Financial institutions utilize their employee talent and product offerings to help individual investors, governments and corporations manage money. This includes managing individual investor retirement accounts; providing investment advice; and overseeing corporate and government retirement plans.According to the Federal Reserve, 53% of households in the U.S. own stocks (or 68 million households, as of 2019). This figure shows stock ownership is greater than 1% of income earners, which is estimated at 1.3 million households. Fed data also states the median value of a households stock holdings is $40,000, representing 55% of total average household financial assets.
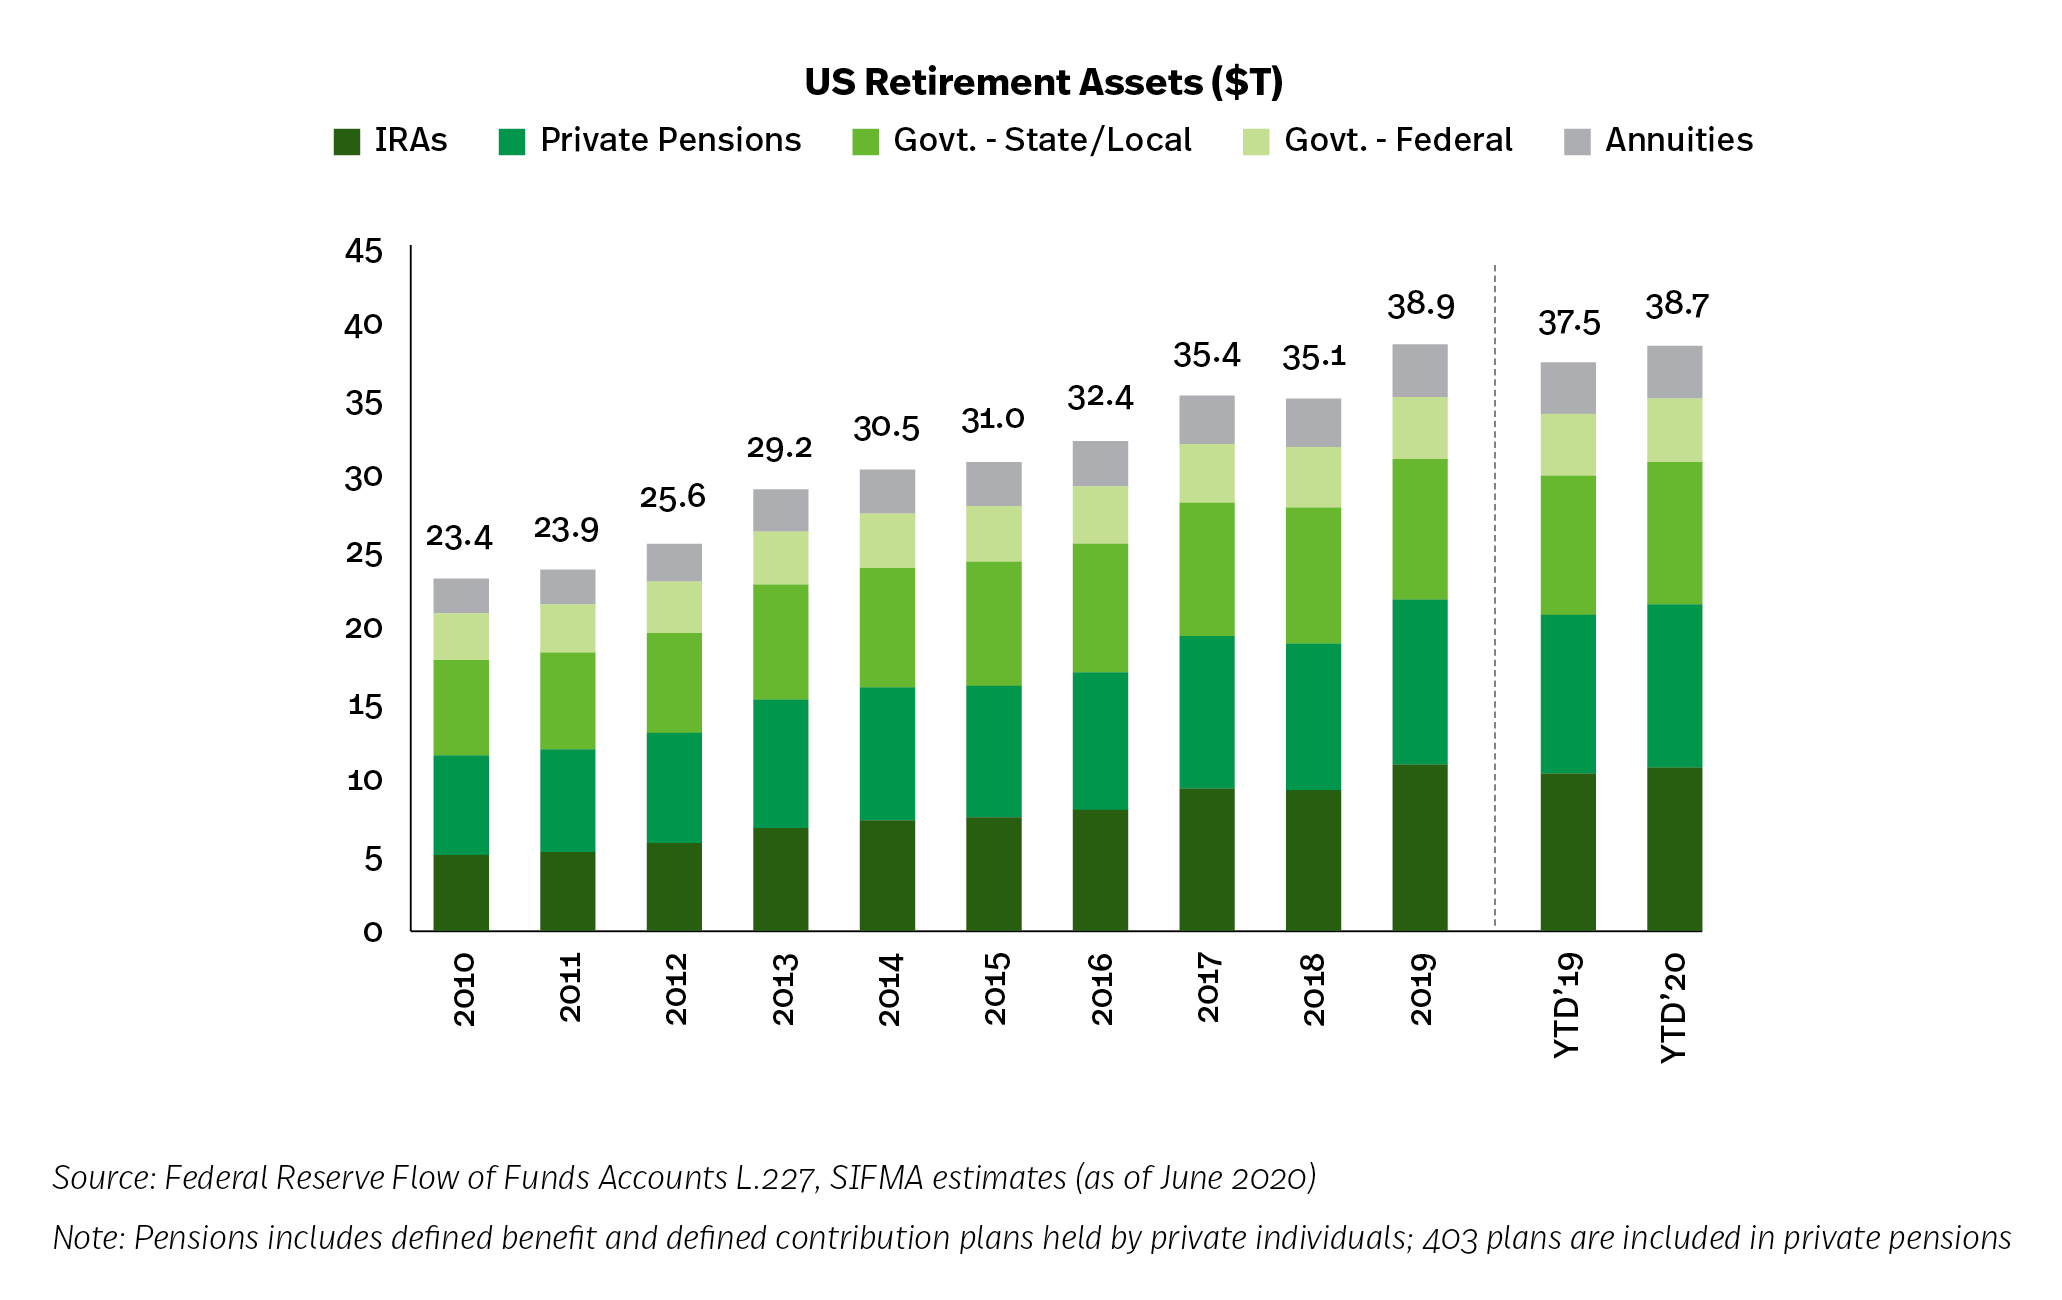
In the U.S., there are $38.9 trillion of retirement market assets, broken out across the following categories (as of June 2020):
- Private pensions, 27.9% ($10.8T); defined contribution $7.2T, defined benefit $3.5T
- IRAs, 27.9% ($10.8T)
- State and local government pensions, 24.4% ($9.4T)
- Federal government pensions, 10.8% ($4.2T)
- Annuities, 9.0% ($3.5T)
- Financial institutions further help investors purchase individual stocks or other securities, such as mutual funds ($16.8 trillion market) and ETFs ($4.4 trillion market)
Individual Investors’ Use of Financial Advisors
www.sifma.org/individual-investors-use-of-financial-advisors/
Industry studies estimate that professional financial advice can add 1.5- 4%* to individual investors’ portfolio returns over the long-term, enabling clients to better meet their goals. Not surprisingly, the majority of this increase will come during periods of heightened volatility in the markets, when advisors step in and help their clients stay the course and keep their long-term objectives in sight. 2020 was no exception and will likely go down as one of the most volatile years on record.
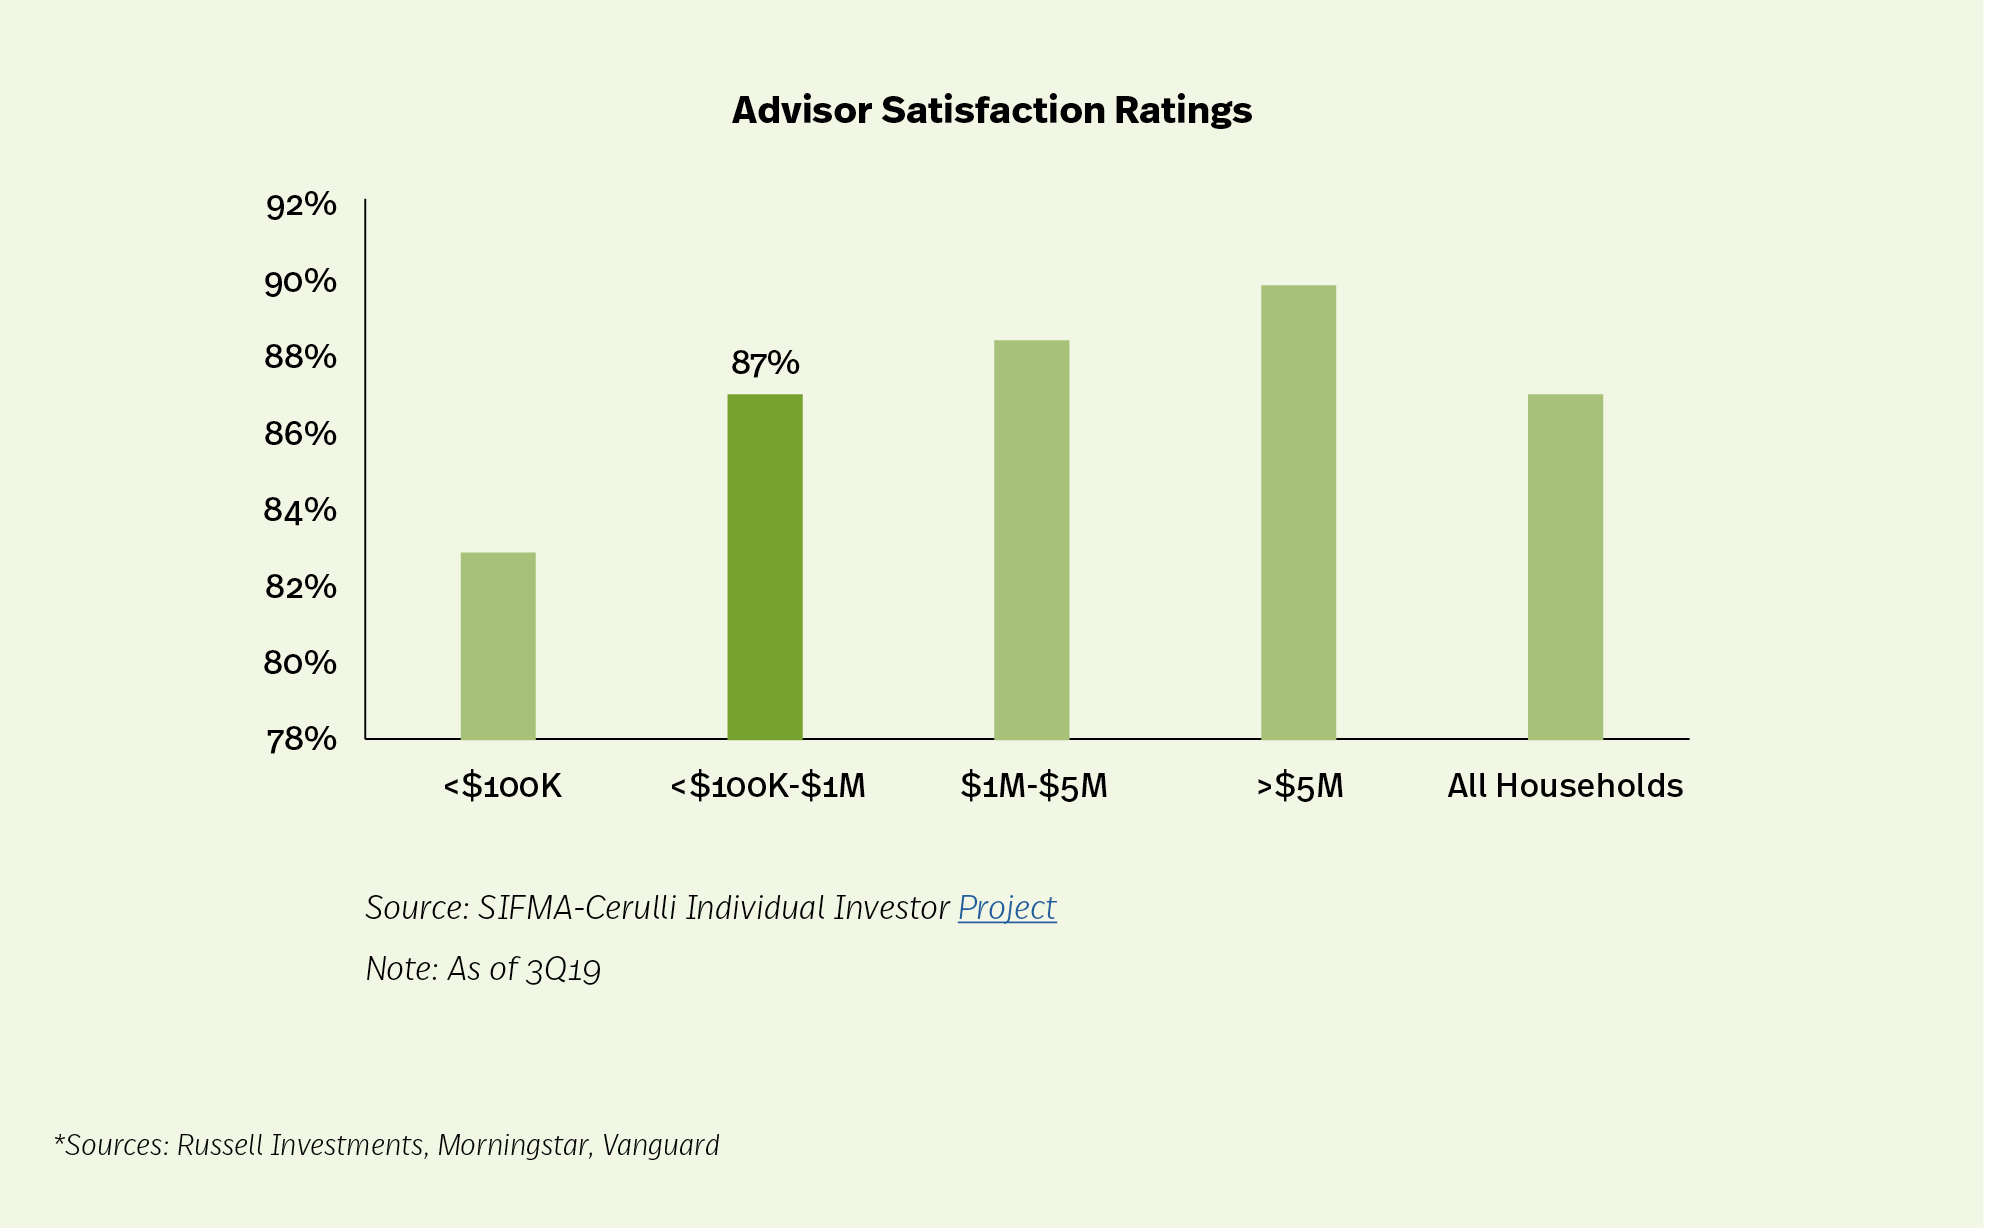
By measures of trustworthiness, dedicated relationships, and personalized advice, advisors are meeting investor standards according to the SIFMA-Cerulli Individual Investor research project. Financial advisors
are a critical link in helping investors reach their financial goals. Research commissioned by SIFMA and conducted by Cerulli Associates explores the relationship between individual investors defined as
households with $100,000 to $1,000,000 of investable assets and their financial advisors. It informs the industry on what is working well, but also sheds light on how financial advisors and firms can continue
to enhance the retail client experience.
The research found that 87% of individual investors with $100K-1M in investable assets express satisfaction with their advisor; less than 1% report being dissatisfied.
Top reasons for individual satisfaction:
- Trustworthiness, honesty, dependability
- Overall relationship
- Knowledge, quality of advice