Market Structure Is the Key to Capital Markets Strength
Efficient and resilient market structure is the key to sustaining investor confidence and participation underpinning the capital markets. The goal of regulators and market participants is to promote market resiliency and ensure markets continue to benefit investors and play an essential role in capital formation.
Market strength is crucial in both primary (issuance) and secondary (trading) markets, which are symbiotic in nature. Efficiently functioning primary markets maintain the depth and liquidity in the secondary markets. Healthy secondary markets give issuers confidence their needs will be met at a good price level in the primary markets, and the cost of capital will be lower at issuance when a liquid secondary market is available. It is important to maintain the robustness and efficiency of secondary markets. In addition to promoting capital formation, investors utilize secondary markets to generate returns and manage risk.
To continue to function efficiently, capital markets need market makers, which stand ready to buy and sell securities at all times, including times of stress, thereby providing liquidity. They need stable, long-term investors and a robust regulatory structure. These factors support the framework for healthy, vibrant capital markets. It is this structural support that is crucial to maintaining the longevity and stability of markets, ensuring they continue functioning even under times of economic or market stress.
The stability of capital markets provides continued fuel for economic growth and job creation.
Equities Issuance & Market Cap
Issuance: Total equity issuance was $221 billion in 2018, essentially flat Y/Y but up 19.7% since the low seen in 2011. Issuance has declined at a 6.2% CAGR over the last five years.Market Cap: Total equity market cap was $30.4 trillion in 2018, -5.2% Y/Y yet +165.6% since the low seen during the financial crisis. Market cap has grown at a 2.9% CAGR over the last five years.
Source: Dealogic, World Federation of Exchanges
Fixed Income Issuance & Outstanding
Issuance: Total fixed income issuance was $7.4 trillion in 2018, -1.4 Y/Y but up 59.2% since the low seen with the financial crisis. Issuance has increased at a 3.1% CAGR over the last five years.
Outstanding: Total fixed income outstanding was $43 trillion in 2018, +4.4% Y/Y and +87.1% since 2004. Outstanding has grown at a 2.7% CAGR over the last five years.
Source: SIFMA
Note: Issuance is long-term instruments only
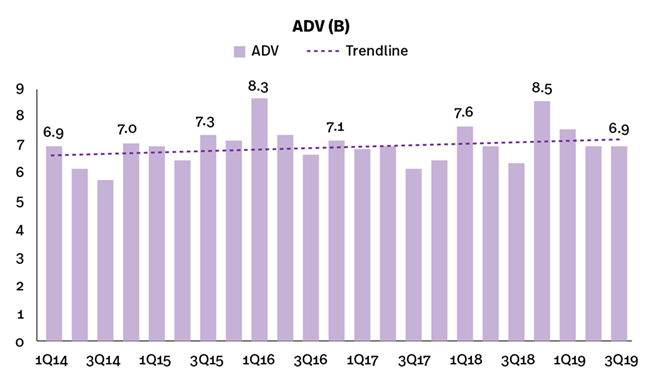
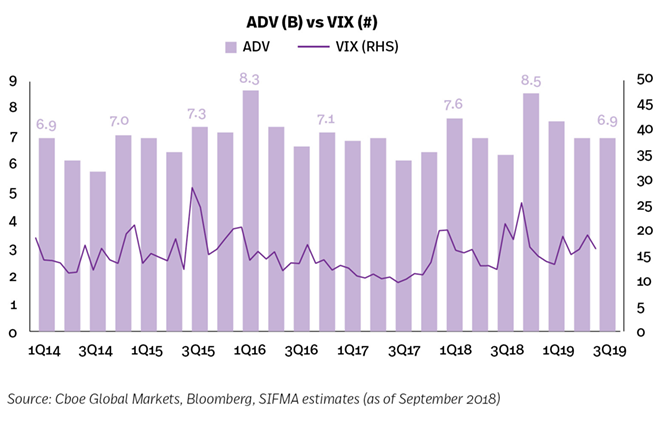
Equities Markets
Investors in U.S. equities markets continue to enjoy narrow spreads, low transaction costs and fast execution speeds. There is also plenty of opportunity for price improvement, especially for retail investors.On average (through September 2019), around 6.9 billion shares are traded on U.S. equity markets every day. ADV averaged 7.5 billion and 7.1 billion for the last 12 to 24 months, while the six month average was 6.9 billion.
Capital Formation
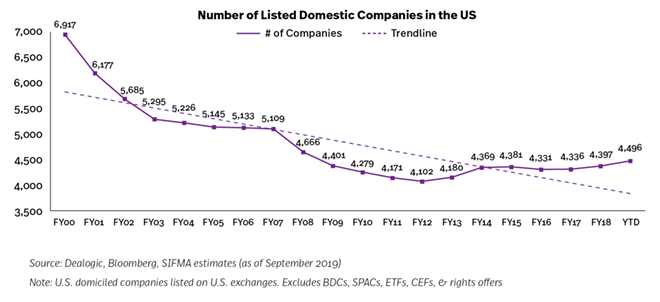
As of September 2019, IPOs totaled $42.4 billion, essentially flat to this time period last year (+0.5%). Of this, $38.2 billion, or 90.0% of the total, was in U.S. domiciled firms, +30.7% Y/Y. The number of deals was 112 YTD, -24.8% Y/Y; U.S. domiciled deals was 88, -22.1% Y/Y. The number of listed domestic companies was 4,496, down 35.0% since 2000 (6,917) but up 9.6% from the 2012 low (4,102).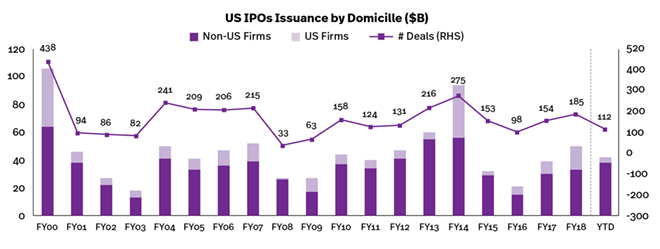
Private Wealth Management
Financial institutions pool their employee talent and product offerings to help individual investors, governments and corporations manage money. This includes: managing individual investor retirement accounts; providing investment advice; and overseeing corporate and government retirement plans.In the U.S., there are $34.6 trillion of retirement market assets, broken out across the following categories:
- Private pensions, 27.2% ($9.4T)
- Defined contribution plans, 63.4% of total pensions or $6.0T
- Defined benefit plans, 36.6% of total pensions or $3.4T
- State and local government pensions, 26.3% ($9.1T)
- IRAs, 25.4% ($8.8T)
- Federal government pensions, 11.6% ($4.0T)
- Annuities, 9.4% ($3.3T)
- Financial institutions further help investors purchase individual stocks or other securities, such as mutual funds ($17.7 trillion market) and ETFs ($3.4 trillion market)
Source: Federal Reserve Flow of Funds, SIFMA estimates
Note: Pensions includes defined benefit and defined contribution plans held by private individuals; 403 plans are included in private pensions
Fintech
The industry continues to analyze how fintech solutions can increase efficiencies in the back office, better serve clients, manage risk or meet regulatory reporting requirements. While much of a firm’s technology spend is on ways to increase operational efficiencies and decrease costs (for the firms and also their customers), many firms also sponsor investments for fintech innovations. As such, we highlight a few fintech topics of interest to market participants.Robotics, Robotic Process Automation (RPA): Robotics and RPA have a shorter time frame to implementation compared with some other emerging technologies. Automation via these fintech capabilities benefits employees and employers, by decreasing time it takes to perform tasks, and clients, by improving straight through processing and other procedures, all while increasing transparency and reducing operational risk. While RPA continues to gain maturity and is implemented in multiple areas, we learned at our annual Operations Conference & Exhibition that the current automation scope is only 3-7%, out of a 40%+ potential to automate. Some analysts have suggested 4 million bots may be active supporting RPA by 2021.
Cloud: Cloud architecture can come in several forms: internal (private), public or hybrids. Initial use cases were to gain raw computing power. Now, firms use clouds to access and utilize data in real time in a flexible and efficient manner and provide platforms for partnerships with third parties and new innovators. Firms can use multiple cloud platforms together while controlling how they interact, with some adopting financial institutions using a combination of 3-4 private and public clouds. Yet, we learned at our annual Operations Conference & Exhibition that only 20% of workloads in financial services have moved to cloud technology. What will the modern cloud architecture look like – secure, fast, real-time access – when firms ramp up for a world requiring more and more data be pulled in (while balancing with resiliency and risk management)?
Artificial Intelligence (AI): AI has been in use at financial institutions for many years, for example: using it for credit scoring in retail banking; using it in CCAR/stress testing to forecast and view changes in results under different macro variables; using it in call centers, where evidence has shown query resolution increases significantly; and other, more simple processes. To continue to grow usage, firms are exploring how to embed AI into the workflow/decision process, for example: KYC/AML monitoring to automate the closing out of cases; or trader conduct surveillance to predict behavior before it happens. However, firms stress that oversight and controls are key in the implementation process. The deployment of AI needs to need to consider where the data came from and how the model operates, understand how to supervise it and ensure AI is supporting with professional decision making, not replacing it.
Repo Markets
A repurchase agreement (repo) is a financial transaction in which one party sells an asset to another party with a promise to repurchase the asset at a pre-specified later date, enabling market participants to provide collateralized loans to one another to manage short-term fluctuations in cash holdings. Repos aid secondary market liquidity for the cash markets (ex: UST), allowing dealers to act as market makers in a very efficient manner and keep secondary cash markets running effectively. This in turn contributes to lower interest rates paid by the issuers, most notably the U.S. Treasury, which lowers debt servicing costs borne by taxpayers.The repo market is a crucial but little-known market that ordinarily hums steadily along. In September 2019, a confluence of technical factors caused a shortage of cash and resulting massive short-term spike in repo rates. The Federal Reserve Bank of New York conducted a series of temporary repo and reverse repo operations to reduce volatility, ensure liquidity, and maintain stability of short-term borrowing rates. The Fed anticipates its interventions will continue into 2020.
Bilateral Repo: Total average daily outstanding was $3.9 trillion in 2018, -3.3% Y/Y and -40.4% since the financial crisis. Outstanding has decreased at a 1.8% CAGR over the last five years.
GCF Repo: Total par amount was $33.3 trillion in 2018, +7.8% Y/Y but -60.0% since the financial crisis. Outstanding has decreased at an 8.0% CAGR over the last five years.
Source: NY Fed, SIFMA estimates
Transitioning to SOFR from LIBOR
The transition from the London Interbank Offered Rate (LIBOR) to alternative interest rate benchmarks is well underway, but much work lies ahead in order to implement a successful reference rate change by the end of 2021. In the U.S., the Alternative Reference Rates Committee (ARRC) is leading the transition away from LIBOR to the Secured Overnight Financing Rate (SOFR). SOFR is based on the overnight repo markets, moving the reference rate from being based on ~$1 billion transactions per day (the most active tenor of LIBOR, three months) to the repo market with around $1 trillion of transactions per day. Publication of the SOFR rate began in April 2018. Trading and clearing of SOFR-based swaps and futures began in May 2018.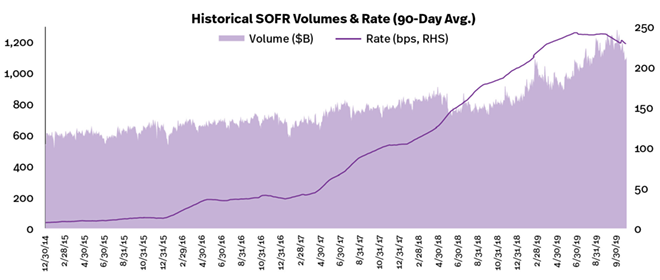
Source: NY Fed, ARRC, CME Group, ICE, LCH, SIFMA estimates Note: SOFR rate = 90 day rolling average