Capital Formation
Issuance
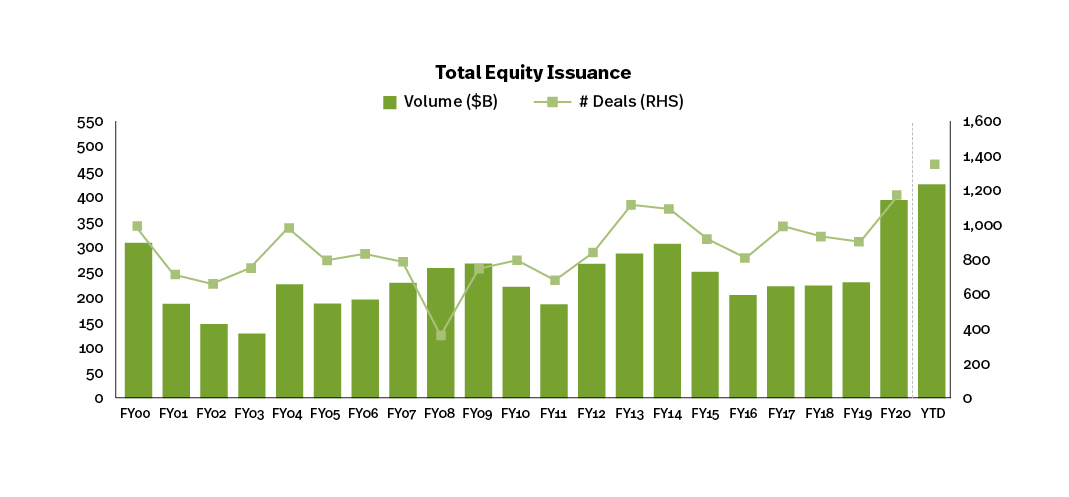
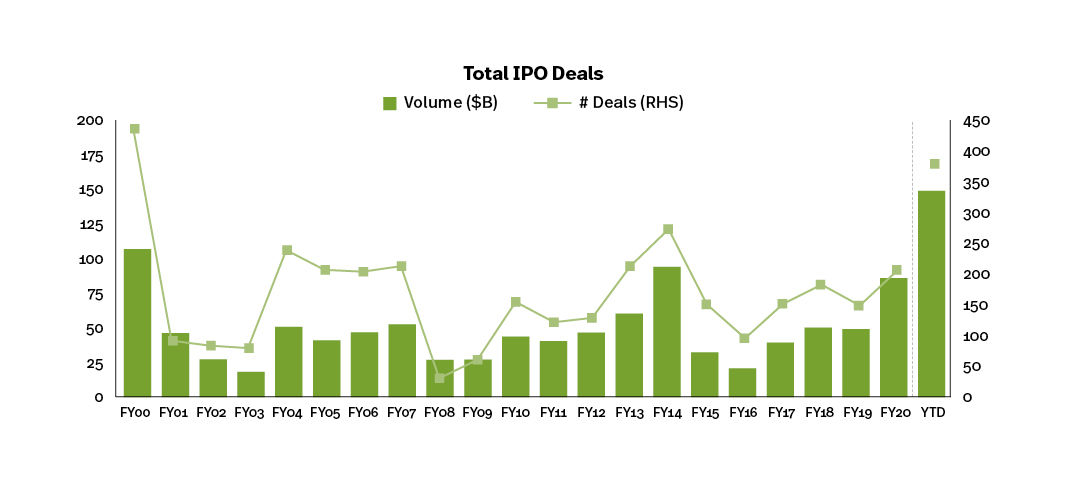
Total U.S. equity issuance was $390 billion in 2020, +71.0% Y/Y, and $421 billion YTD 2021 (through November), +22.9% Y/Y. IPOs totaled $85 billion in 2020, +74.9% Y/Y, and $148 billion YTD (through November), +104.3% Y/Y. Total issuance has increased at a +9.4% CAGR over the last five years, with IPOs experiencing a +21.6% CAGR.
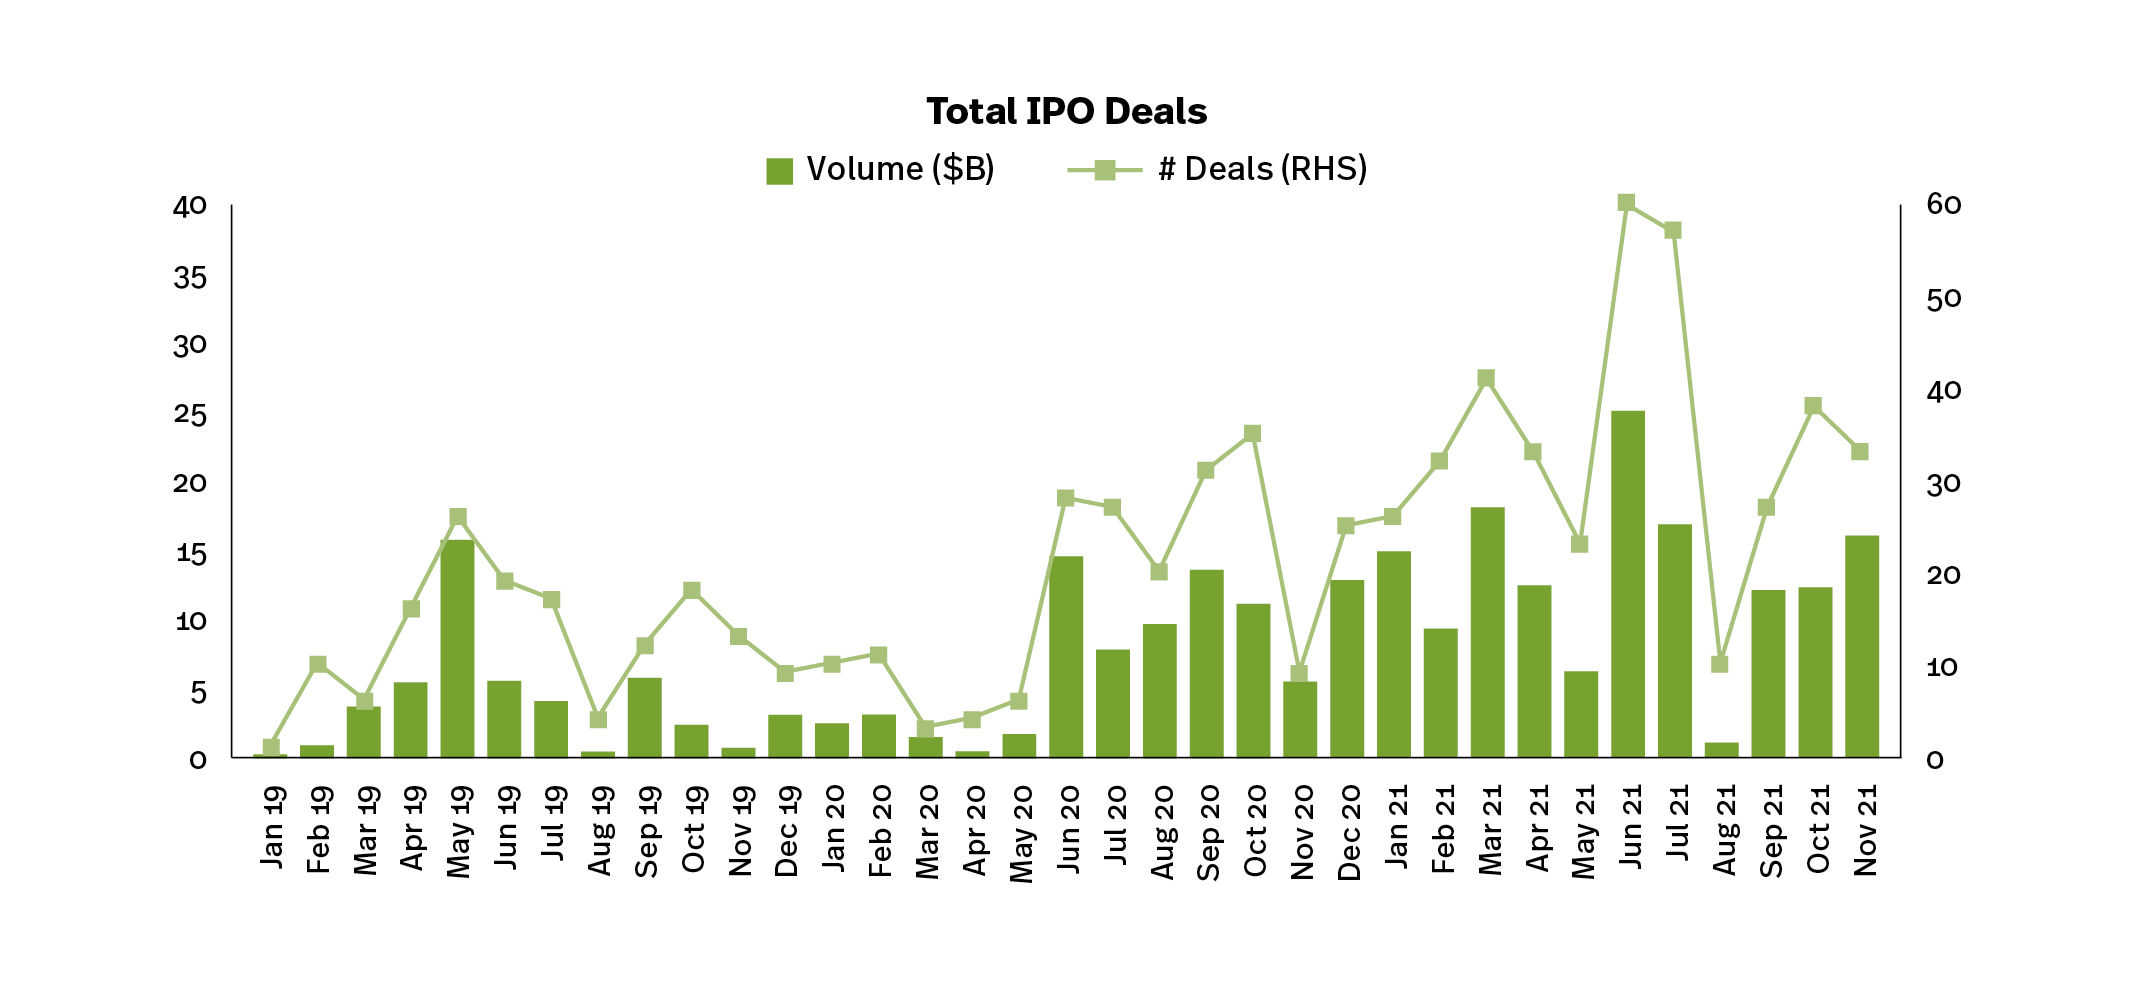
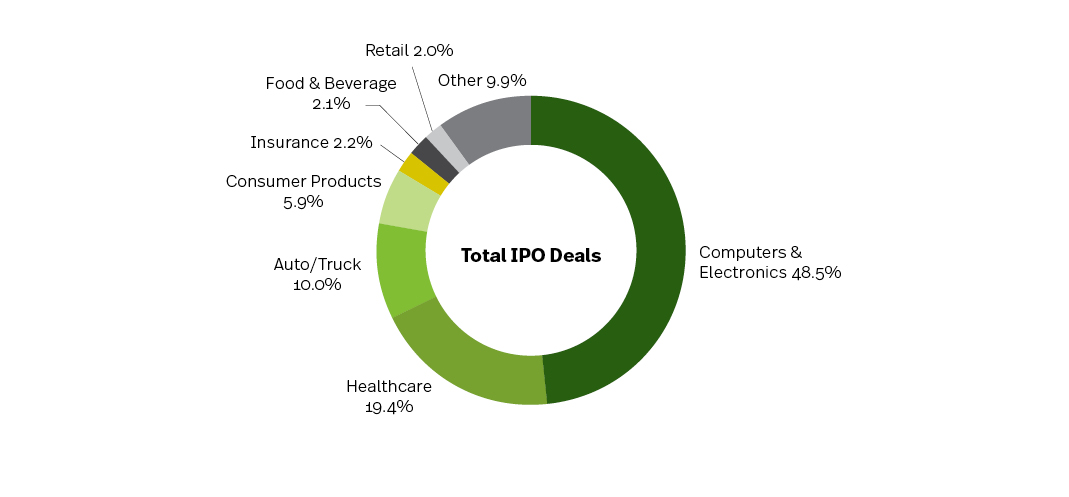
As of November 2021, IPOs totaled $147.8 billion, +104.3% Y/Y. Of this, $111.7 billion, or 75.6% of the total, was in U.S. domiciled firms, +0.3 pps Y/Y. The number of deals was 381 YTD, +107.1% Y/Y; U.S. domiciled deals was 292, +114.7% Y/Y. The top three sectors in IPOs issuance YTD were Computers & Electronics (48.5% of total), Healthcare (19.4%) and Auto/Truck (10.0%).
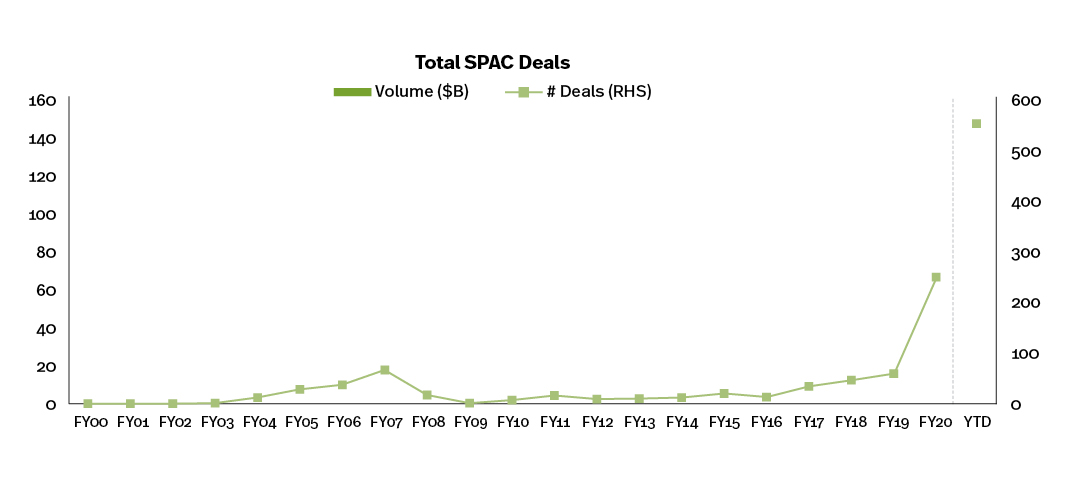
Total SPAC issuance was $83 billion in 2020, +517.3% Y/Y, and $151 billion YTD 2021 (through November), +115.7% Y/Y.
Source: Dealogic
Note: Total equity and IPOs Includes rank eligible deals; excludes BDCs, SPACs, ETFs, CLEFs & rights offers; SPAC = special purpose acquisition company, includes blank check companies (as of November 2021)
Market Cap & Listed Companies
Total U.S. equity market cap was $41.6 billion in 2020, +22.0% Y/Y, and $48.3 billion YTD (through October), +34.0% Y/Y. Market cap has grown at a +10.6% CAGR over the last five years.The number of listed domestic companies was 4,631 YTD, down 26.2% since 2000 (6,274) but up 12.9% from the 2012 low (4,102).
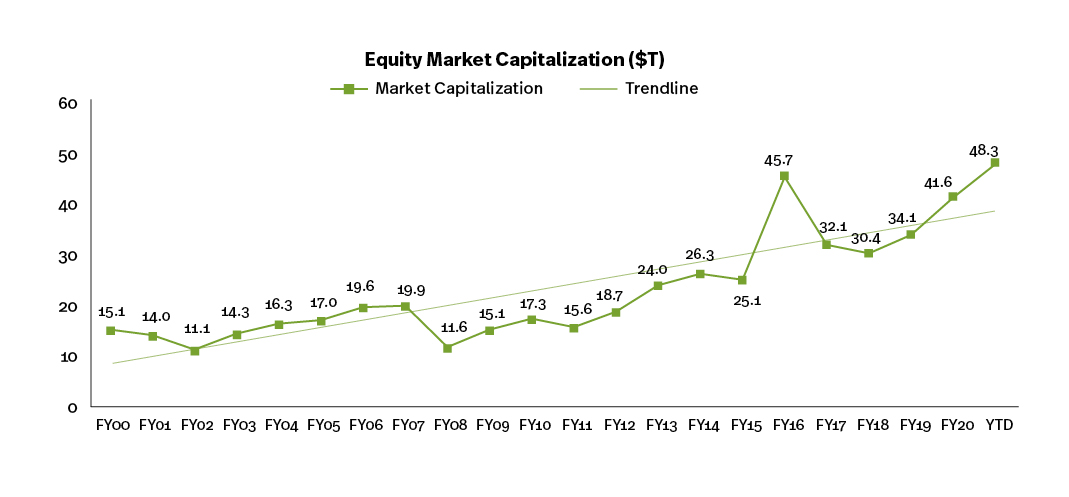
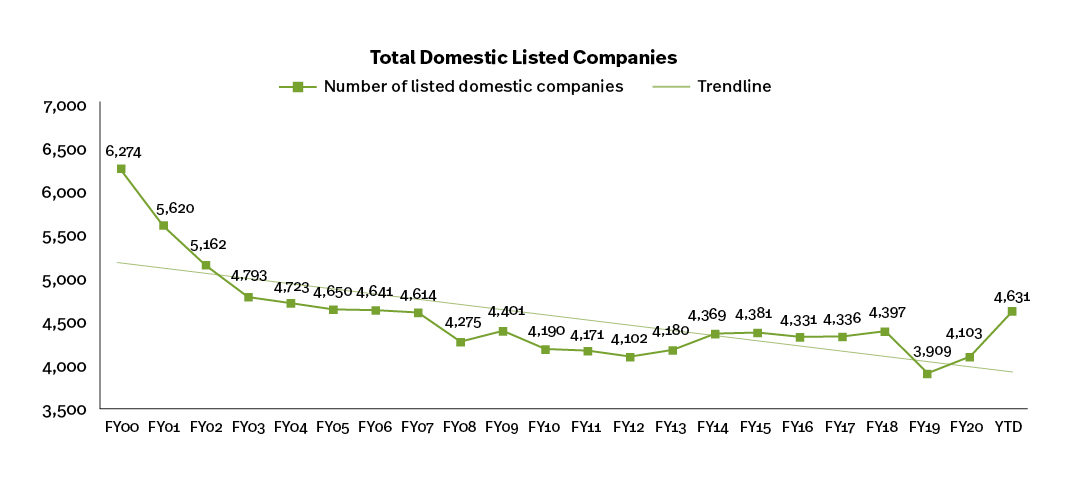
Source: World Federation of Exchanges (as of September 2021)
Volatility, Equity & Options Volumes
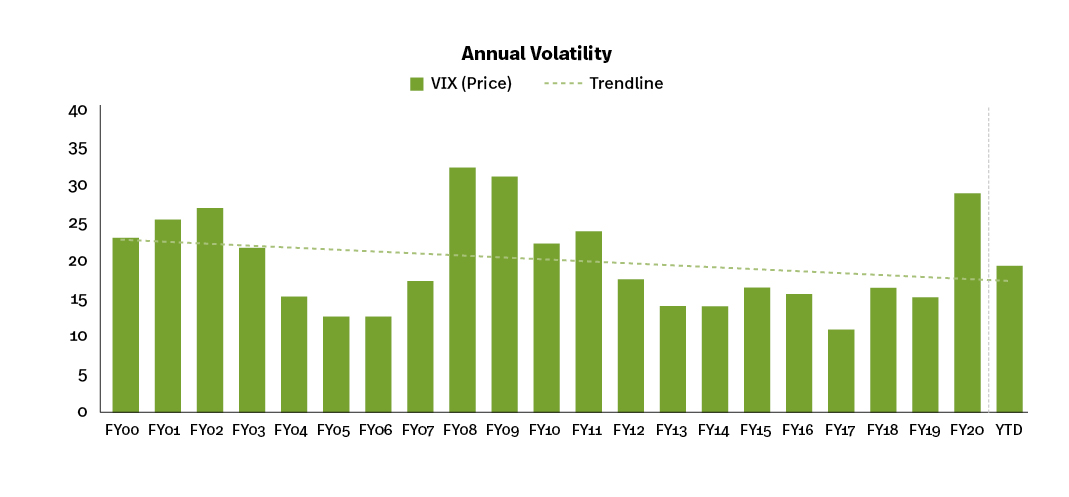
Volatility (VIX)
YTD (through November), average volatility as measured by the VIX was 19.49, -34.8% Y/Y. This is compared to an average VIX of 15.39 historically, +26.7%. The VIX averaged 19.75 and 24.15 for the last 12 and 24 months, while the six-month average was 18.03.
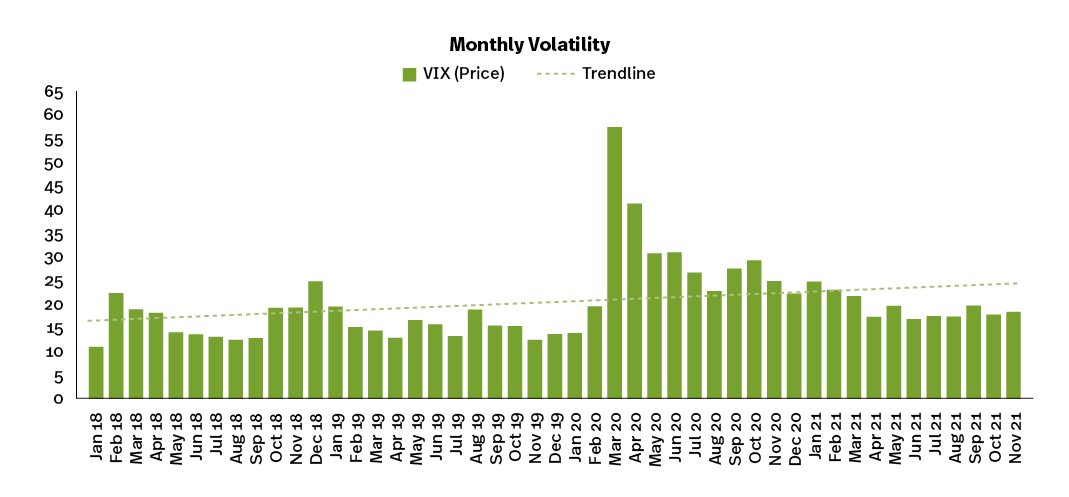
Source: Bloomberg, SIFMA estimates (as of November 2021)
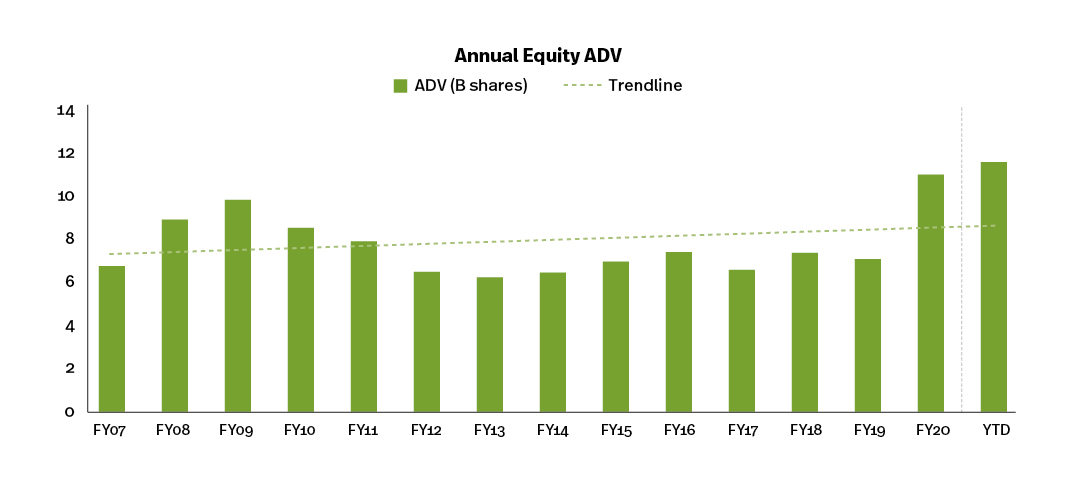
Equity Volumes
Around 11.5 billion shares are traded on U.S. equity markets every day (through November), +5.0% Y/Y. This is compared to around 7.4 billion shares historically, +54.8%. ADV averaged 11.4 billion shares and 11.0 billion shares for the last 12 to 24 months, while the six-month average was 10.3 billion shares.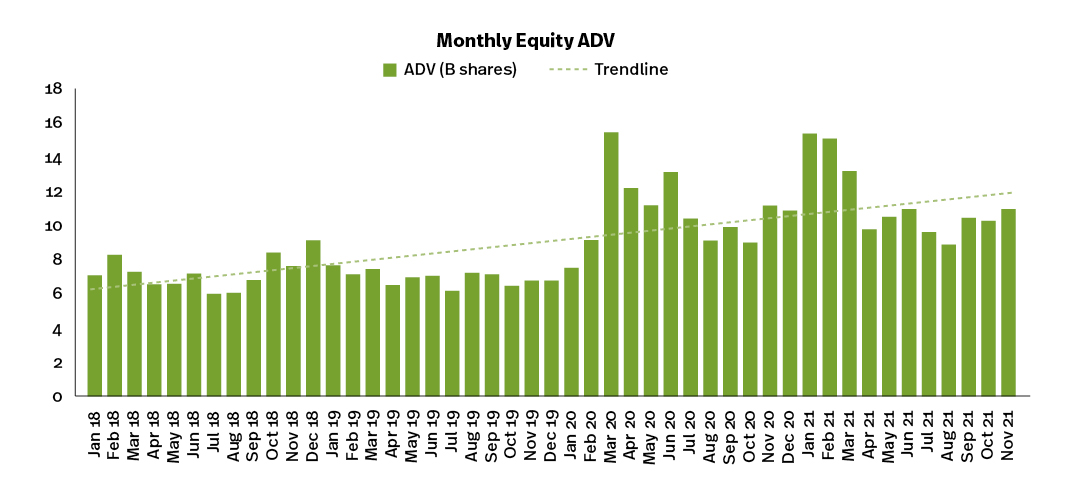
Source: Cboe Global Markets, SIFMA estimates (as of November 2021)
Options Volumes
Around 39.2 million contracts are traded each day in the U.S. multi-listed options market (through November), +35.0% Y/Y. This is compared to around 16.7 million contracts historically, +135.0%. ADV averaged 38.8 million contracts and 33.5 million contracts for the last 12 and 24 months, while the six-month average was 39.3 million contracts.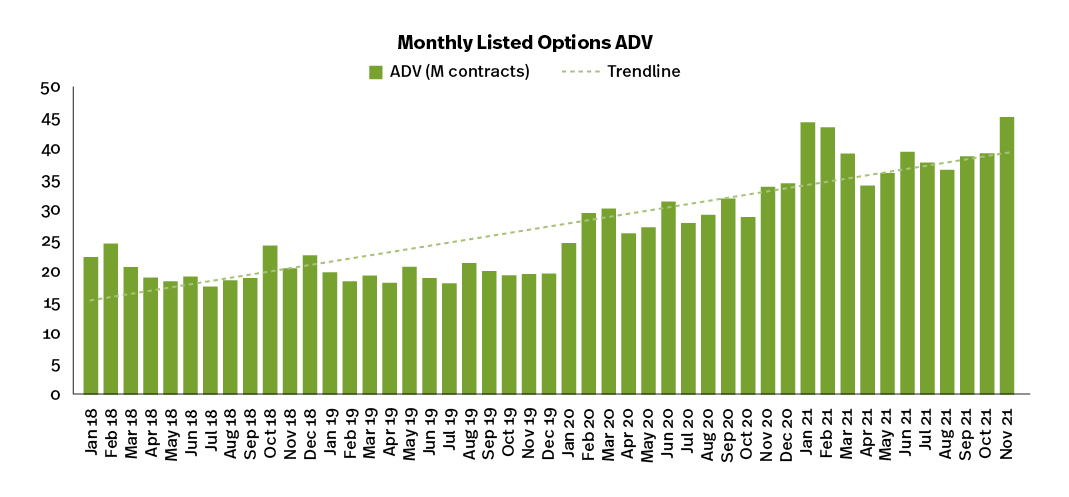
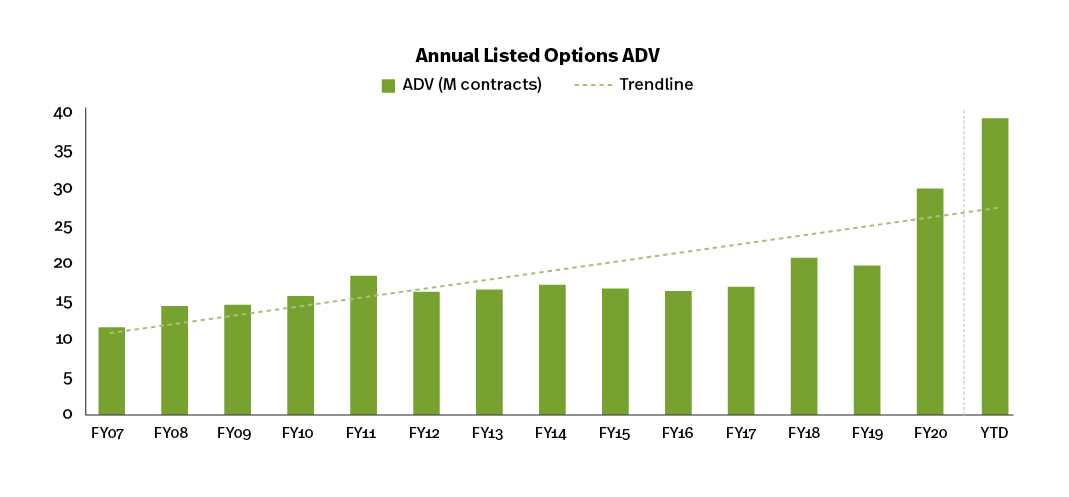
Source: OCC, SIFMA estimates (as of November 2021)
Fixed Income Issuance & Outstanding
Issuance
Total fixed income issuance was $12.2 trillion in 2020, +44.5 Y/Y, and $12.1 trillion YTD 2021 (through November), +7.5% Y/Y. Issuance has increased at a +12.4% CAGR over the last five years.
U.S. Treasury issuance was $20.9 trillion in 2020, +73.6% Y/Y, and $17.9 trillion YTD 2021 (through November), -5.8% Y/Y. Issuance has increased at a +24.5% CAGR over the last five years.
Long-term U.S. Treasury issuance was $3.9 trillion in 2020, +32.7% Y/Y, and $4.7 trillion YTD 2021 (through November), +35.7% Y/Y. Issuance has increased at a +12.9% CAGR over the last five years.
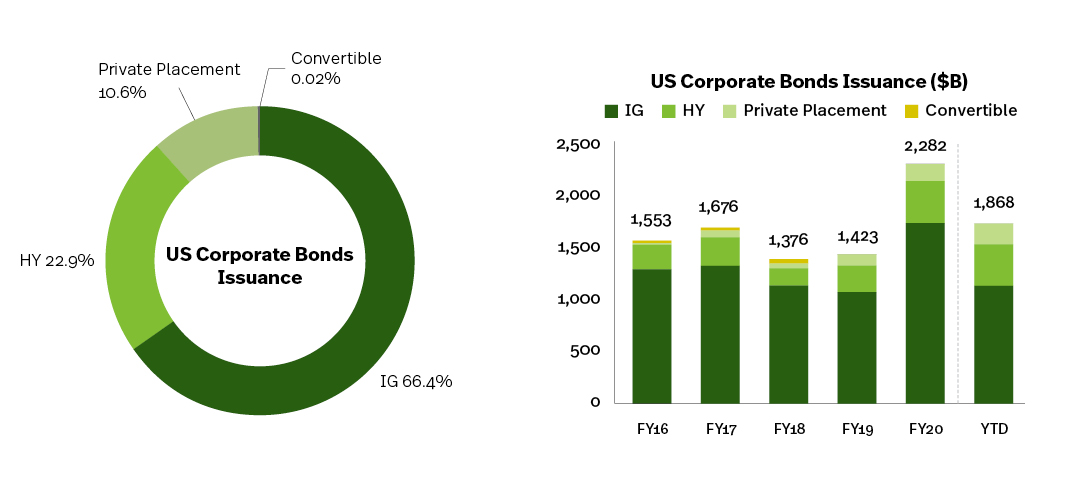
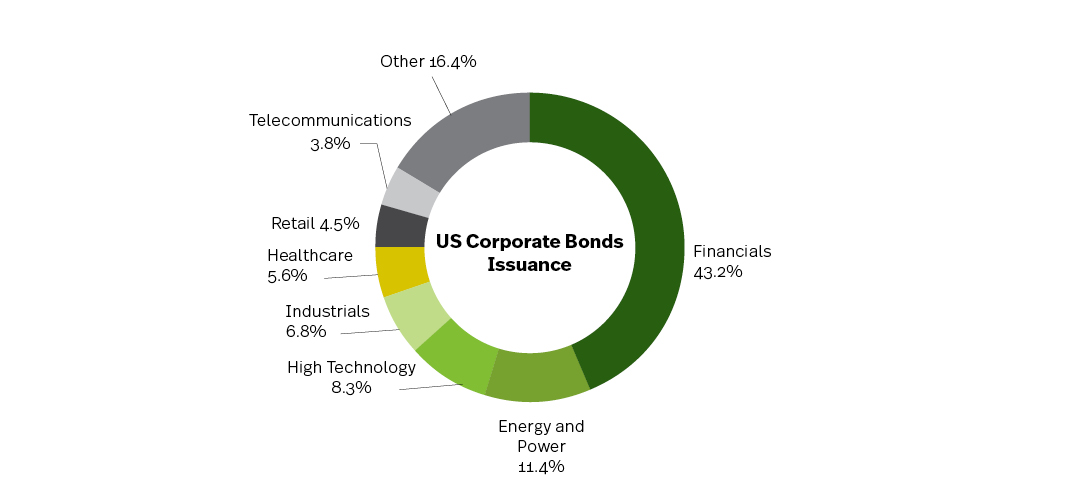
Corporate bonds issuance was $2.3 trillion in 2020, +60.4 Y/Y, and $1.9 trillion YTD 2021 (through November), -15.7% Y/Y. Issuance has increased at a +8.6% CAGR over the last five years. The top three sectors corporate
bonds issuance YTD were Financials (43.2% of total), Energy & Power (11.4%) and High Technology (8.3%).
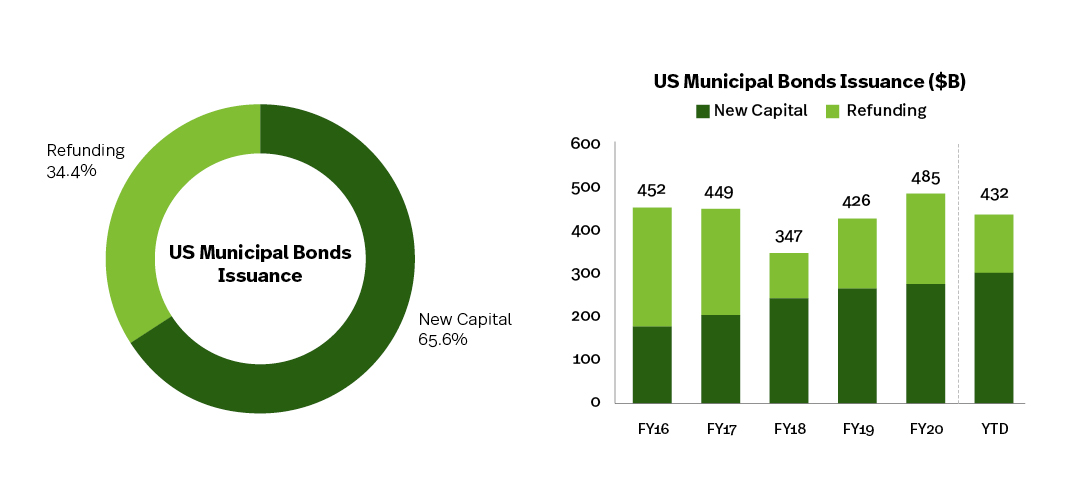
Municipal bonds issuance was $484.5 billion in 2020, +13.6% Y/Y, and $432.2 billion YTD 2021 (through November), -3.9% Y/Y. Issuance has increased at a +3.6% CAGR over the last five years.
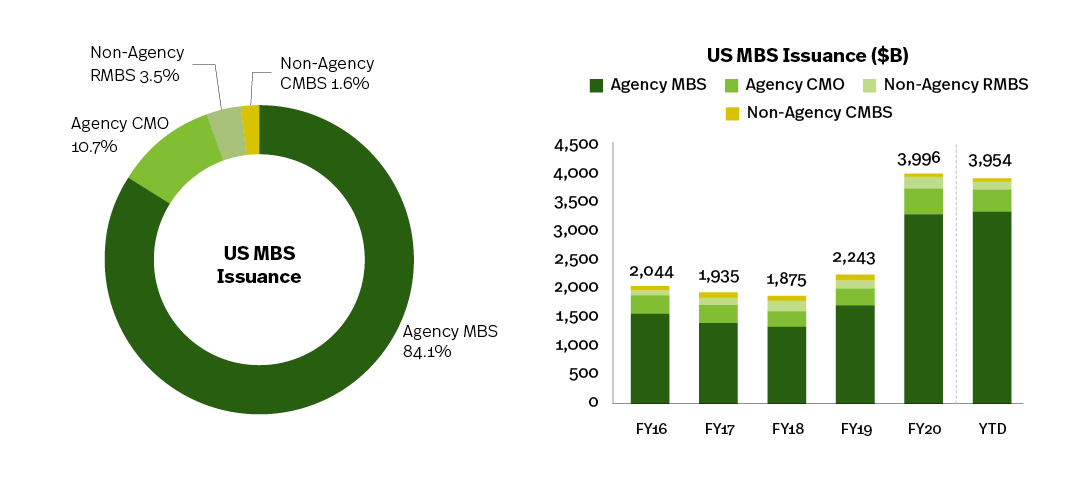
MBS issuance was $4.0 trillion in 2020, +78.2% Y/Y, and $4.0 trillion YTD 2021 (through November), +10.2% Y/Y.
Issuance has increased at a +17.3% CAGR over the last five years.
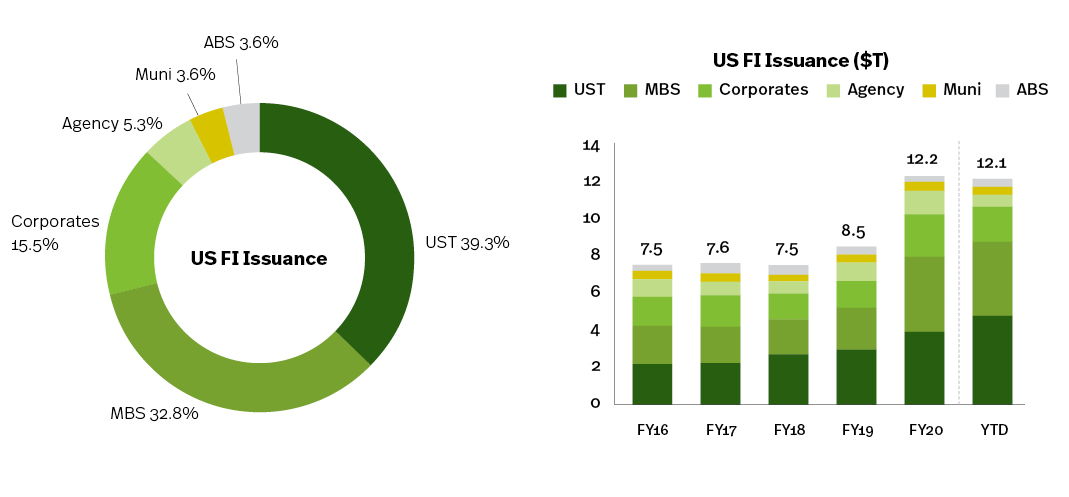
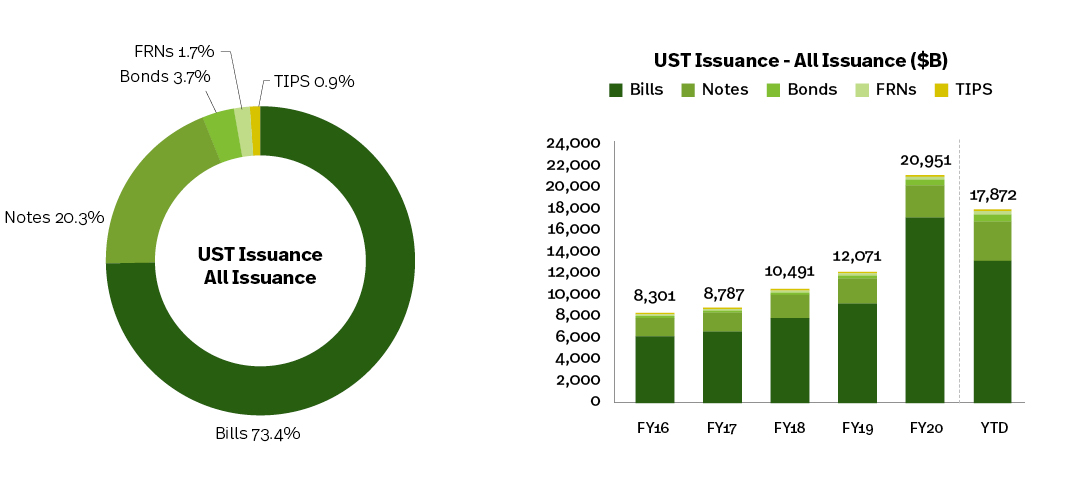
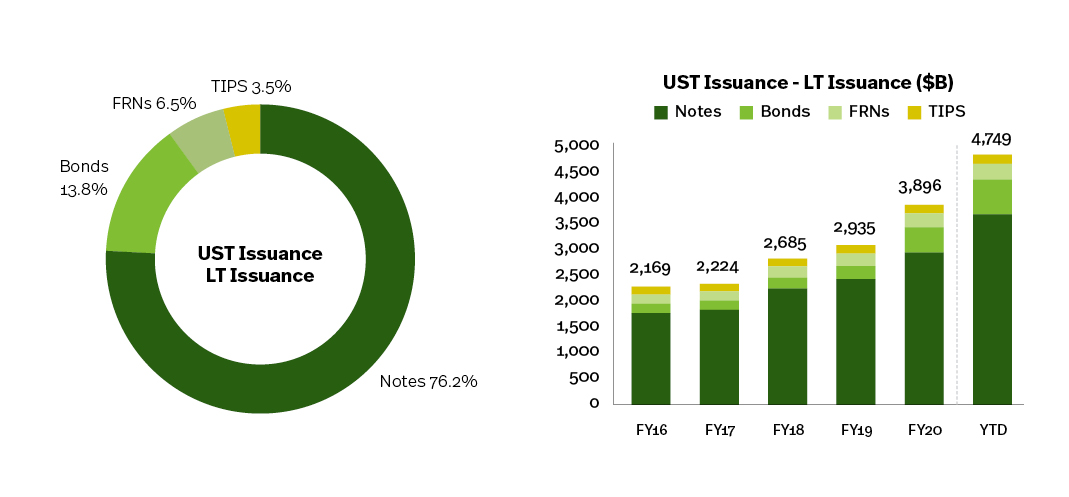
Sources: Bloomberg, Federal Reserve Bank of New York, FINRA, Municipal Securities Rulemaking Board, Refinitiv, US Agencies, US Treasury, SIFMA estimates (as of October 2021)
Outstanding
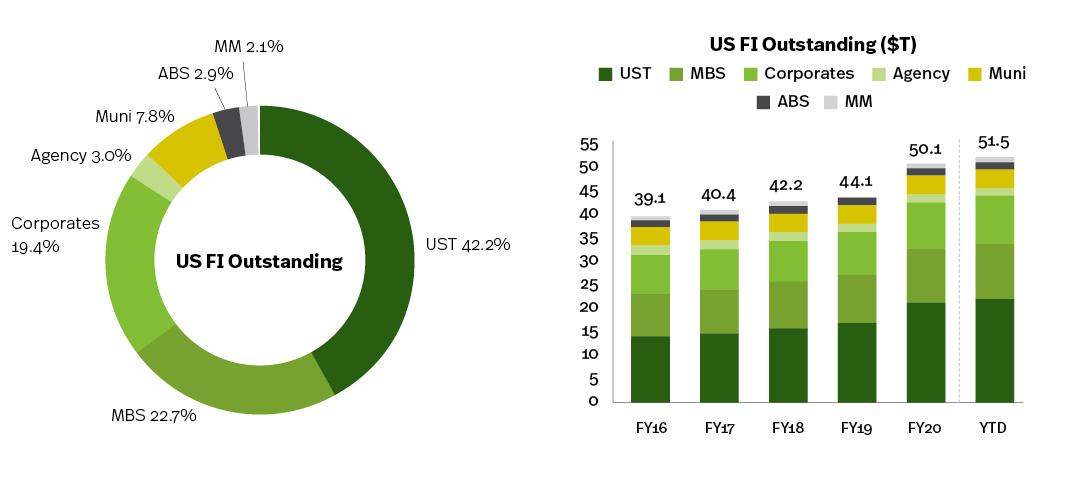
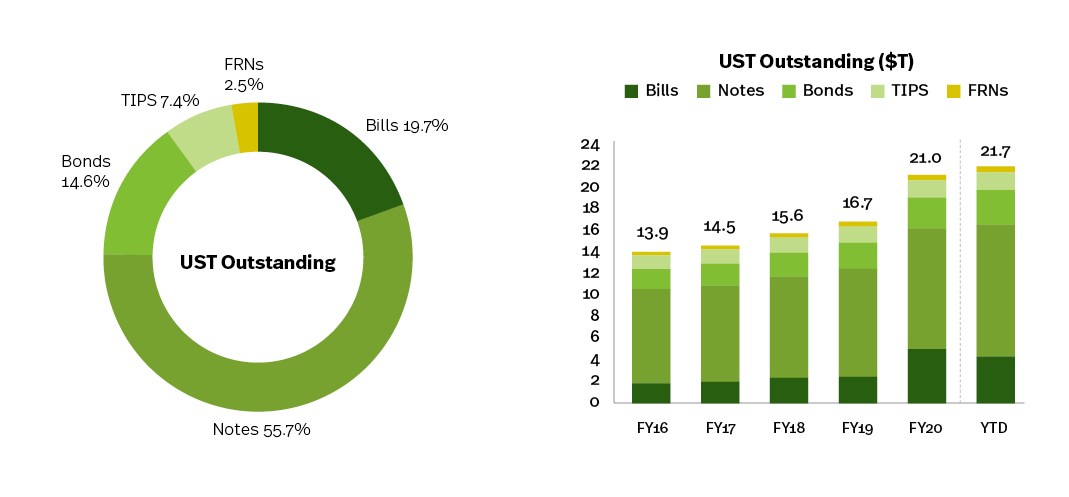
Total fixed income outstanding was $50.1 trillion in 2020, +13.7% Y/Y, and $51.5 trillion YTD 2021 (through June), +5.8% Y/Y. Outstanding has grown at a +5.7% CAGR over the last five years.U.S. Treasury outstanding was $21.0 trillion in 2020, +25.8% Y/Y, and $21.7 trillion YTD 2021 (through June), +9.2% Y/Y. Outstanding has grown at a +9.7% CAGR over the last five years.
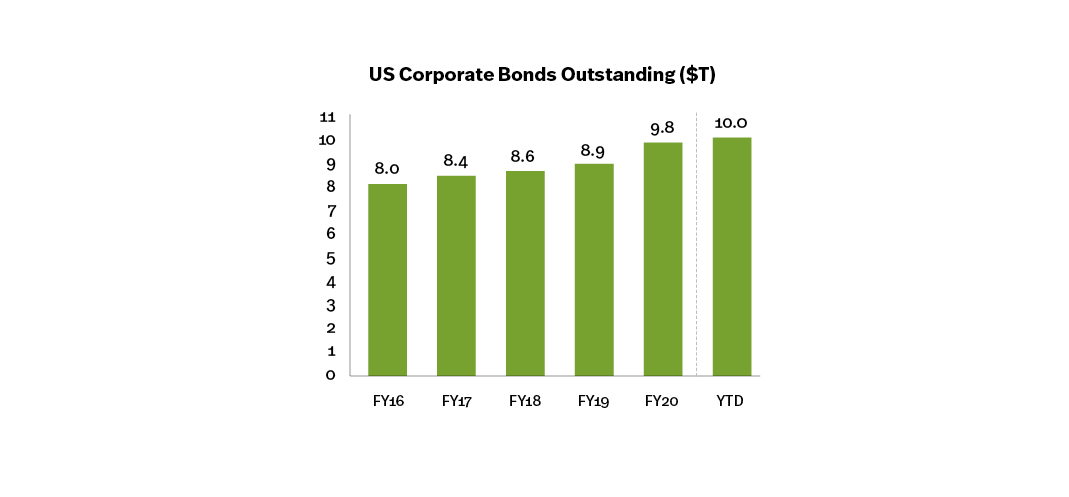
Corporate bonds outstanding was $9.8 trillion in 2020, +10.0% Y/Y, and $10.0 trillion YTD 2021 (through June), +2.6% Y/Y. Outstanding has grown at a +5.0% CAGR over the last five years.
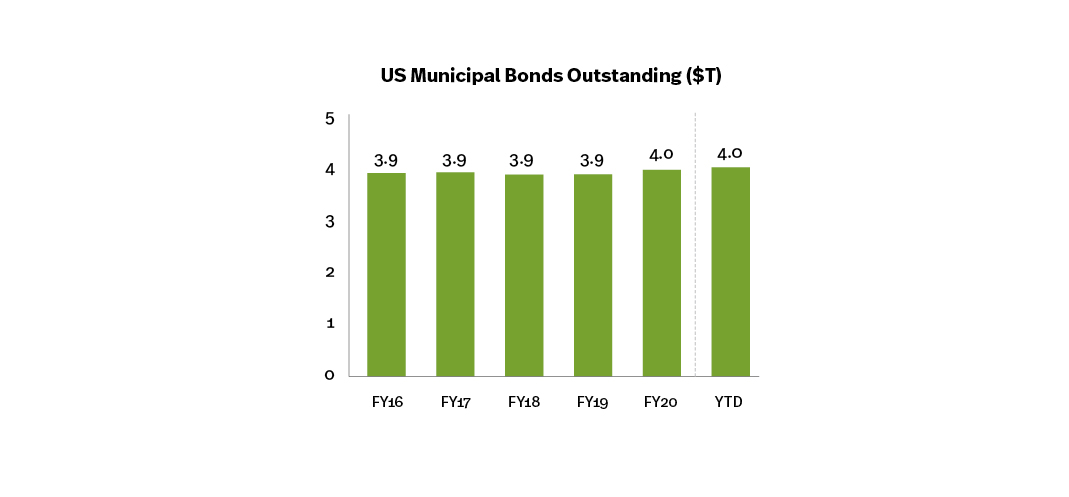
Municipal bonds outstanding was $4.0 trillion in 2020, +2.2% Y/Y, and $4.0 trillion YTD 2021 (through June), +2.7% Y/Y. Outstanding has grown at a +0.6% CAGR over the last five years.
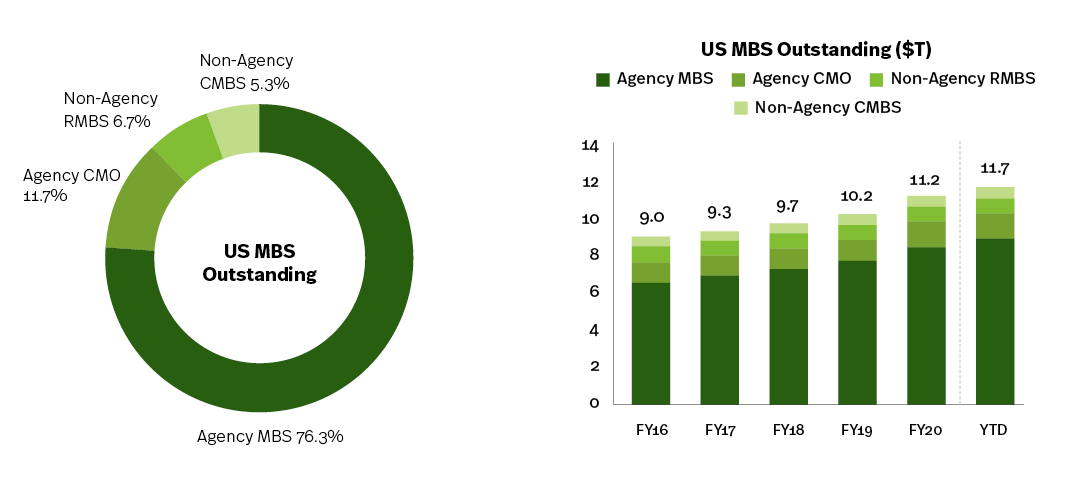
MBS outstanding was $11.2 trillion in 2020, +9.6% Y/Y, and $11.7 trillion YTD 2021 (through June), +9.1% Y/Y.
Outstanding has grown at a +4.7% CAGR over the last five years.
Source: Refinitiv, Bloomberg, New York Federal Reserve, The Federal Reserve, US Agencies, US Treasury, SIFMA estimates (as of June 2021)
SOFR Transition
In the U.S., the transition continues from the London Interbank Offered Rate (LIBOR) to the alternative interest rate benchmark, the Secured Overnight Financing Rate (SOFR). SOFR is based on the overnight repo markets, moving the reference rate from being based on around $1 billion transactions per day (the most active tenor of LIBOR, three months) to the repo market with around $1 trillion transactions per day. Publication of the SOFR rate began in April 2018, with trading and clearing of SOFR-based futures and swaps starting in May 2018.As of October 30, the SOFR rate was 4.9 bps (90 day rolling average). Fed data puts volumes at $847 billion. Market volumes (as of August 2021) stand at $6.3 trillion for futures contracts, with an aggregate notional outstanding of $136.5 trillion for all SOFR related products.
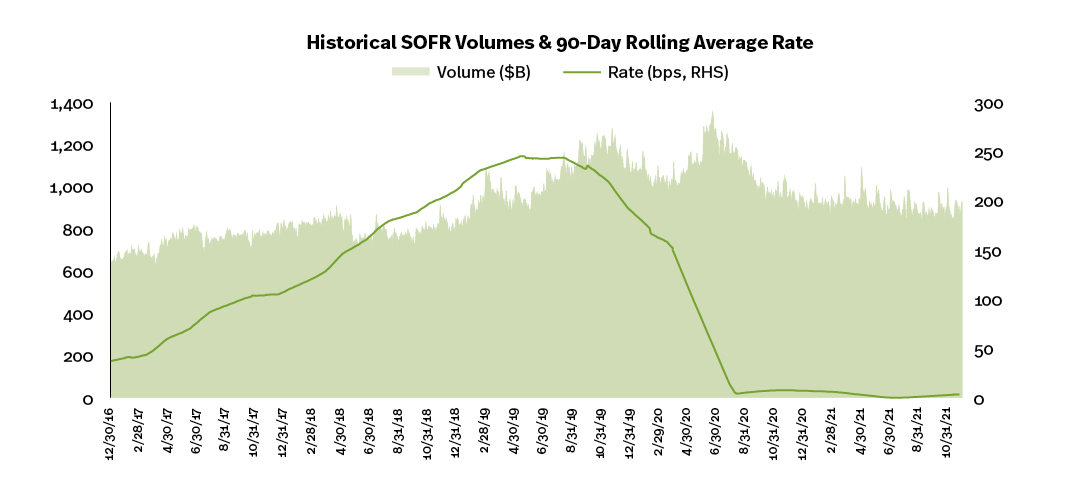
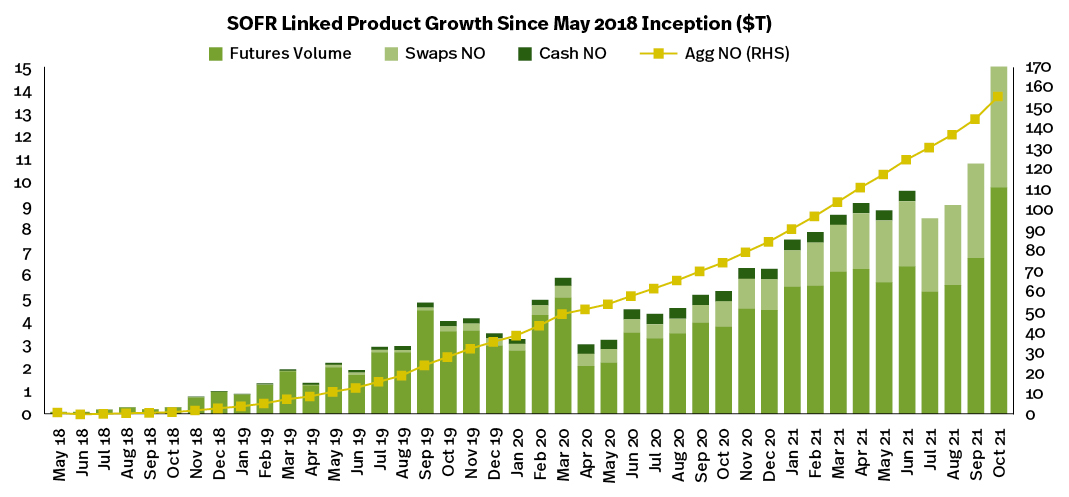
Source: Rate = NY Fed, linked products = ARRC, CME Group, ICE, LCH, cash not available starting Jul’21 (as of October 2021)
Private Wealth Management
Stock Ownership
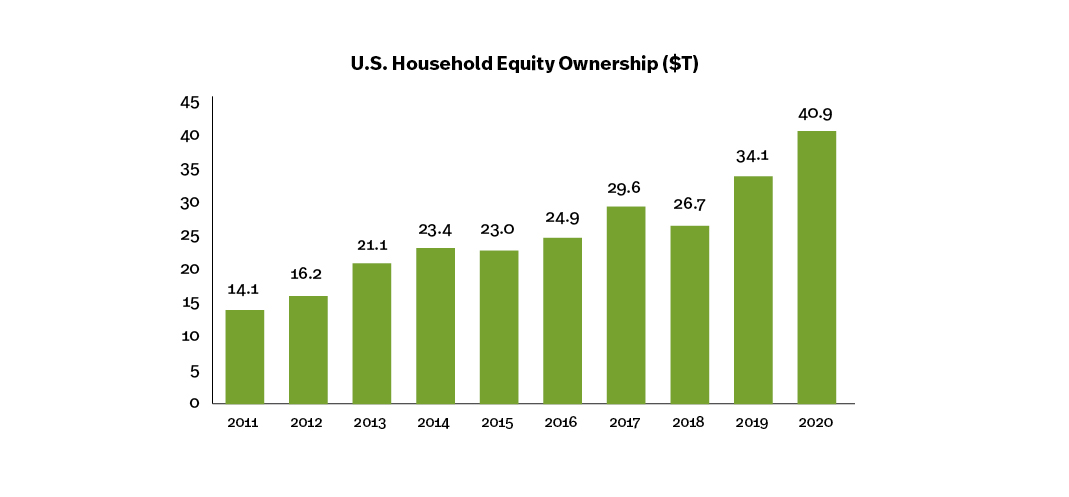
According to the Federal Reserve, 53% of households in the U.S. own stocks (or 68 million households, as of 2019). This figure shows stock ownership is greater than 1% of income earners, which is estimated at 1.3 million households. Fed data also states the median value of a households stock holdings is $40,000, representing 55% of total average household financial assets.
Households represent 37.7% of total equity holders in the U.S. The next largest holder group is mutual funds, and individual and household ownership of mutual funds was at 45.5% as of 2019. ETFs come in at 6.4% of total equity holders, with 8% of U.S. households owning ETFs. Private pensions hold 5.4% of total equities.
Source: The Federal Reserve – Financial Accounts of the United States
Note: Household sector includes nonprofit organizations; includes both directly and indirectly held equities (i.e. through mutual funds).
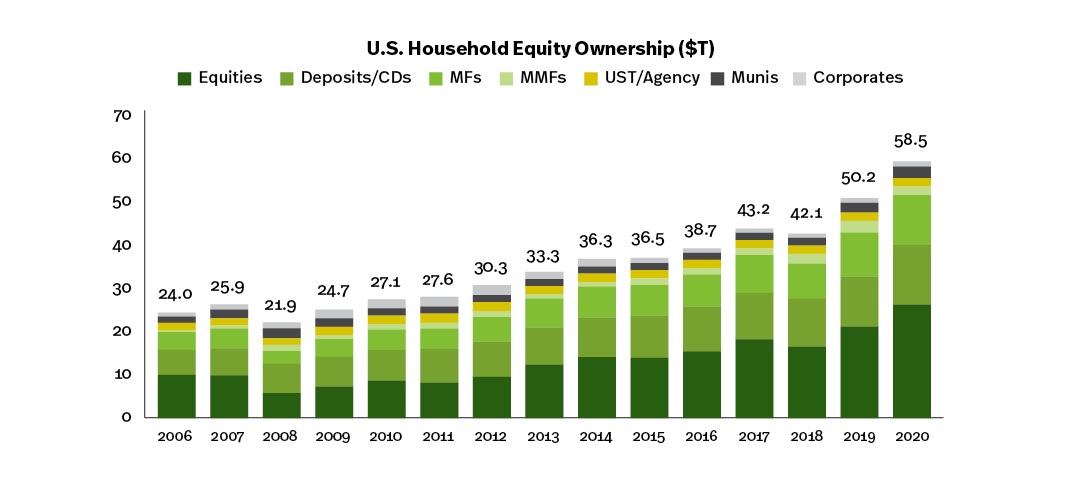
US Household Liquid Assets
U.S. households own 58.5 trillion in liquid assets. This is a 16.7% year-over-year increase, or a 8.6% CAGR over the last five years. Asset ownership for 2020 is broken out by:- Equities $25.9 trillion, 44.2% of total
- Bank Deposits/CDs $13.7 trillion, 23.4% of total
- Mutual Funds (MF) $11.2 trillion, 19.2% of total
- Money Market Funds (MMF) $2.6 trillion, 4.4% of total
- U.S. Treasury (UST)/Agency/GSE Securities $2.0 trillion, 3.4% of total
- Municipal Bonds (Munis) $1.9 trillion, 3.3% of total
- Corporate Bonds $1.2 trillion, 2.1% of total
Source: The Federal Reserve – Financial Accounts of the United States
Note: Households include nonprofit organizations. Liquid financial assets exclude pension fund reserves, equity in non-corporate business, etc.
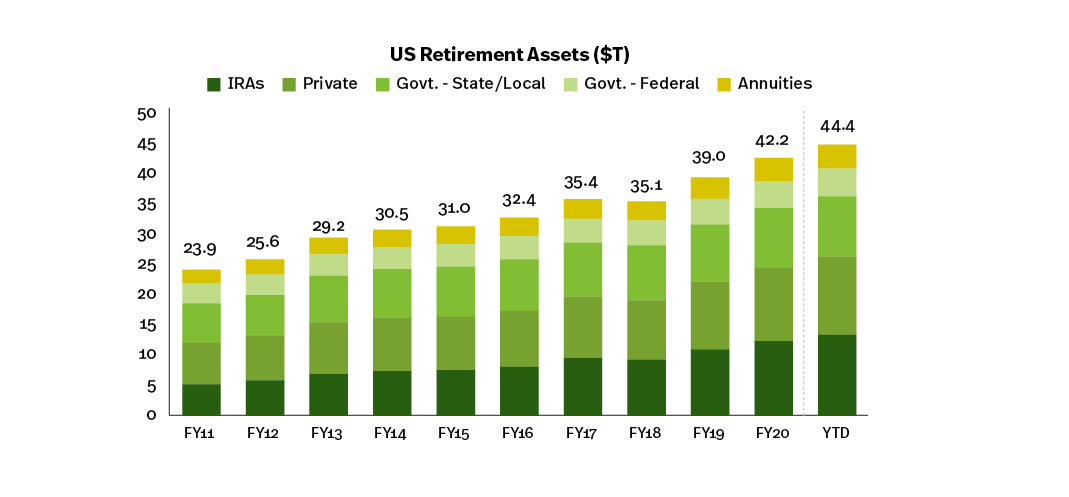
Retirement Assets
According to market research firm Cerulli Associates, individual investors¹ hold $7 trillion with securities firms, with an average relationship size of $150,000. There are over 34 million households with between $100,000 and $1,000,000 in investable assets, representing 27% of the U.S. population. These investors control nearly 21% of investable assets in the U.S., over $11.6 trillion. 78% of individual investors report using a professional financial advisor.The Federal Reserve reports that there are $44.4 trillion of total retirement market assets in the U.S., broken out across the following categories (as of June 2021):
- IRAs, 29.8% ($13.2T)
- Private pensions, 28.8% ($12.8T)
-
- ‒ Defined contribution plans, 70.9% of total pensions or $9.1T
- ‒ Defined benefit plans, 29.1% of total pensions or $3.7T
-
- State and local government pensions, 22.2% ($9.9T)
- Federal government pensions, 10.3% ($4.5T)
- Annuities, 8.8% ($3.9T)
- Financial institutions further help investors purchase individual stocks or other securities, such as mutual funds ($21.5 trillion market) and ETFs ($6.5 trillion market)
Source: Federal Reserve Flow of Funds Accounts, SIFMA estimates (as of June 2021)
Note: Pensions includes defined benefit and defined contribution plans held by private individuals; 403 plans are included in private pensions
1 As of 2020. Households with $100,000 to $1 million of investable assets
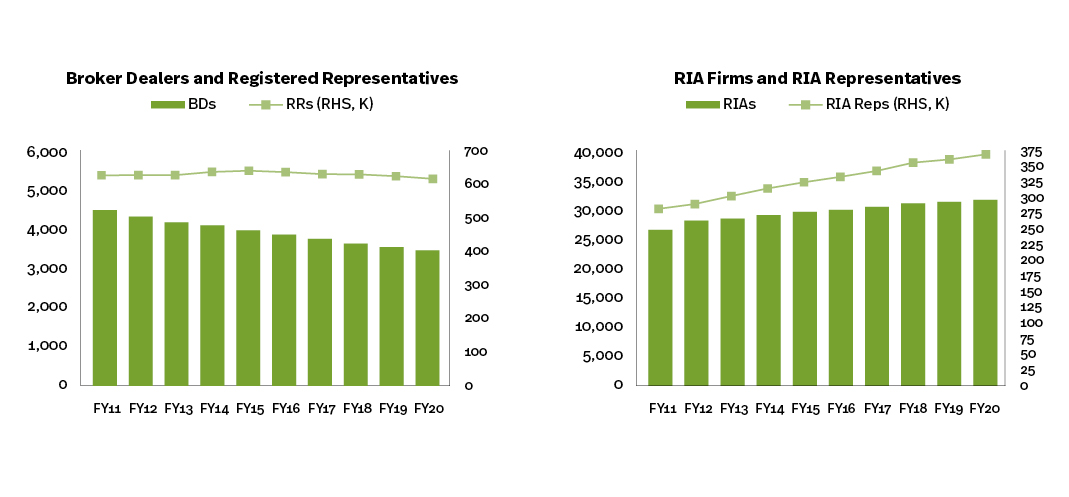
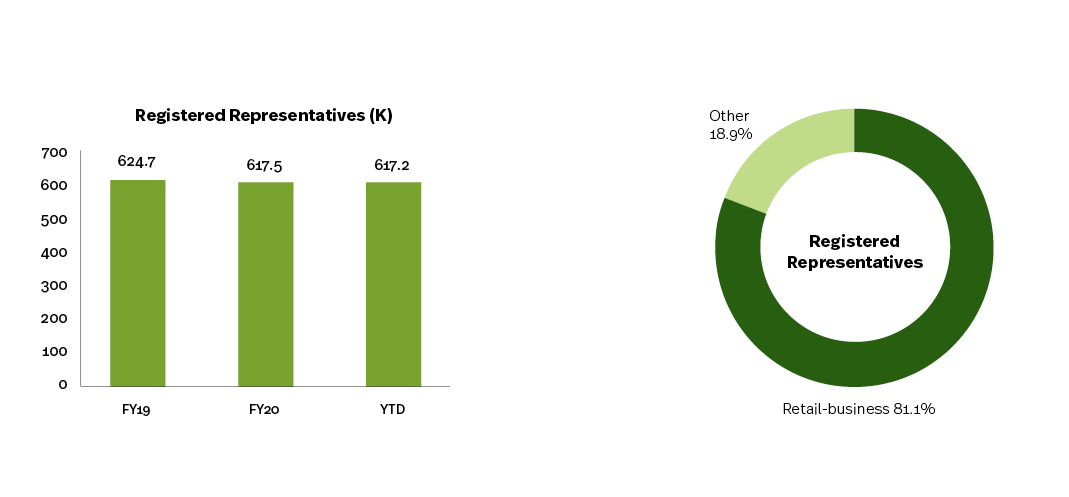
FINRA-Registered Firms and Registered Representative
Financial institutions pool their employee talent and product offerings to help individual investors, governments and corporations manage their money. This includes: managing individual investor retirement accounts; providing investment advice; overseeing corporate and government retirement plans; and many other offerings.- 3,435 firms; -2.3% Y/Y, -2.7% 5-year CAGR
- 167.5 thousand registered reps; -1.1% Y/Y, -0.7% 5-year CAGR
- 31,393 RIA firms; +1.1% Y/Y, +1.4% 5-year CAGR
- 369.1 thousand RIA reps; +2.2% Y/Y, +2.5% 5-year CAGR
Source: Discovery Data, FINRA, SIFMA estimates (YTD as of November 2021)
Note: Counts include dually-registered firms and reps