
Top 10 Takeaways from SIFMA’s 2024 Capital Markets Fact Book
Recapping 2023 Statistics for US and Global Capital Markets
SIFMA Research recently published our annual Capital Markets Fact Book, which provides a comprehensive look at U.S. capital markets, as well as a look into global markets. Inside this report, we recap:
- Global Capital Markets: Equity and fixed income markets (market capitalization, outstanding, issuance, trading volumes, market performance); investment banking landscape; international securities transactions; etc.
- U.S. Capital Markets: Equity, fixed income, derivatives and private placement markets (outstanding, issuance, volumes, index prices); investment banking landscape; mutual fund and ETF statistics; etc.
- U.S. Investor Participation: Household liquid financial asset breakout; household equity ownership; and holders of equities.
- U.S. Savings & Investment: Retirement asset breakout and mix across asset classes; savings rates and other economic indicators; and federal balance sheet overview.
- U.S. Securities Industry: Number of broker-dealers, registered representatives, registered investment advisors, and branch offices; industry financial overview; and state maps showing number firms/reps.
In the U.S., capital markets fuel the economy, providing 74.1% of equity and debt financing for non-financial corporations. Capital markets enable debt issuance, a more efficient, stable, and less restrictive form of lending for corporations. Debt capital markets are more dominant in the U.S. at 74.9% of total financing, whereas bank lending is more dominant in other regions, at 80.7% on average.
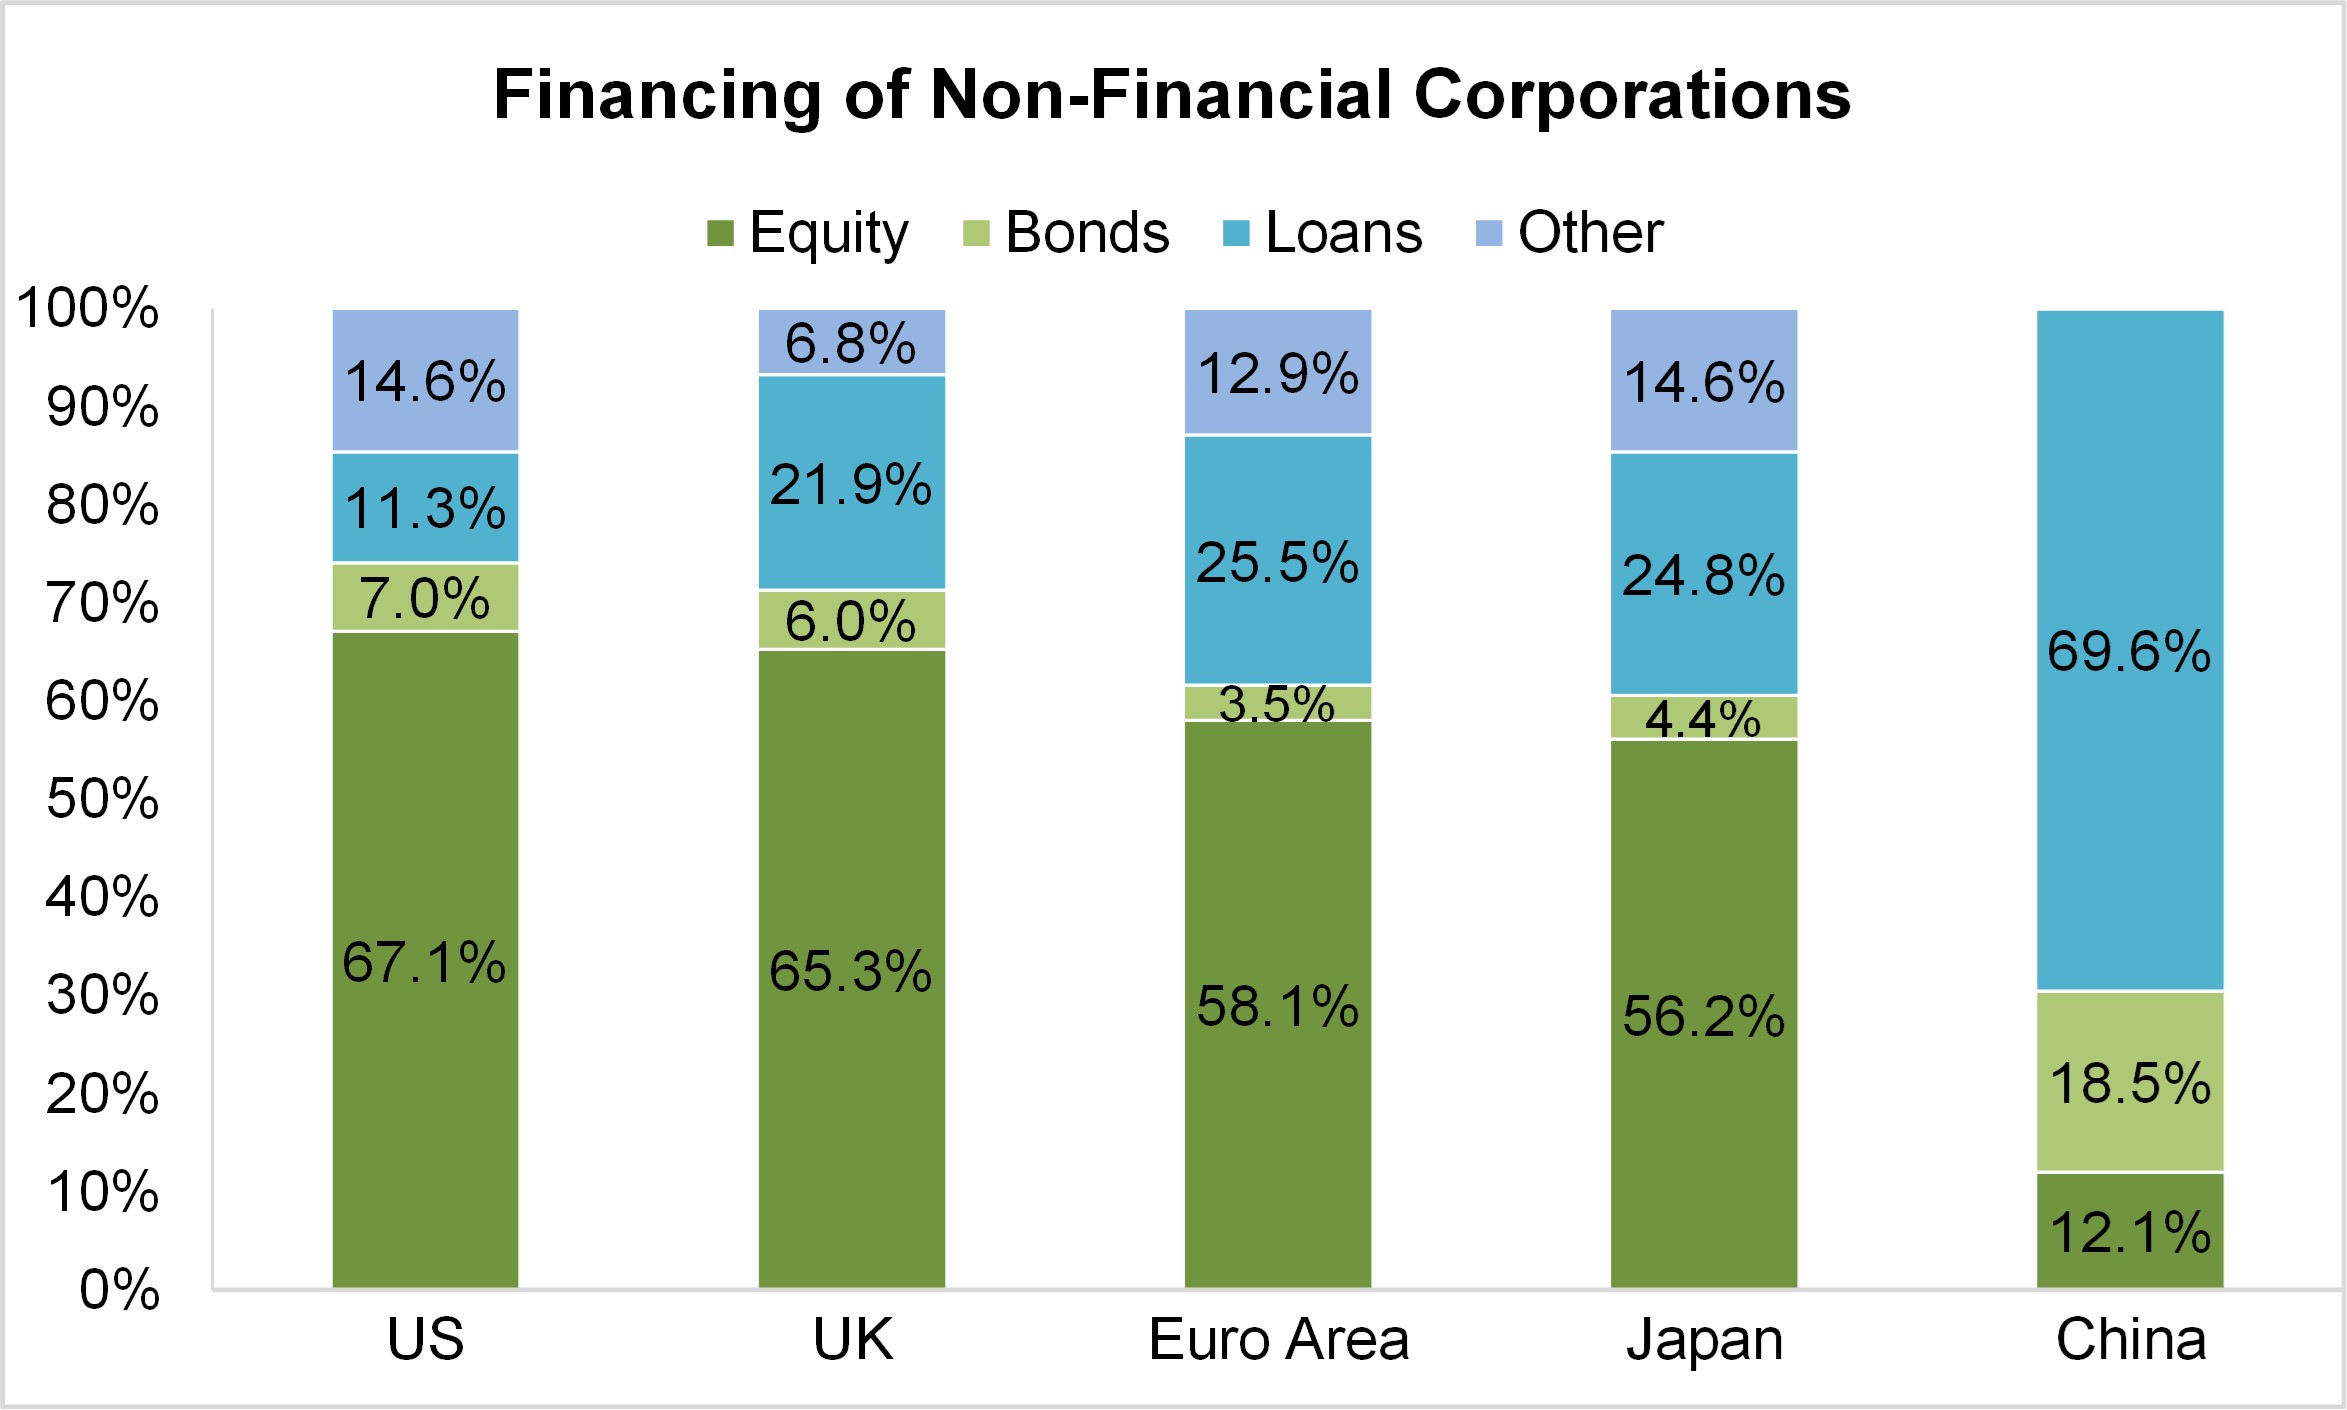
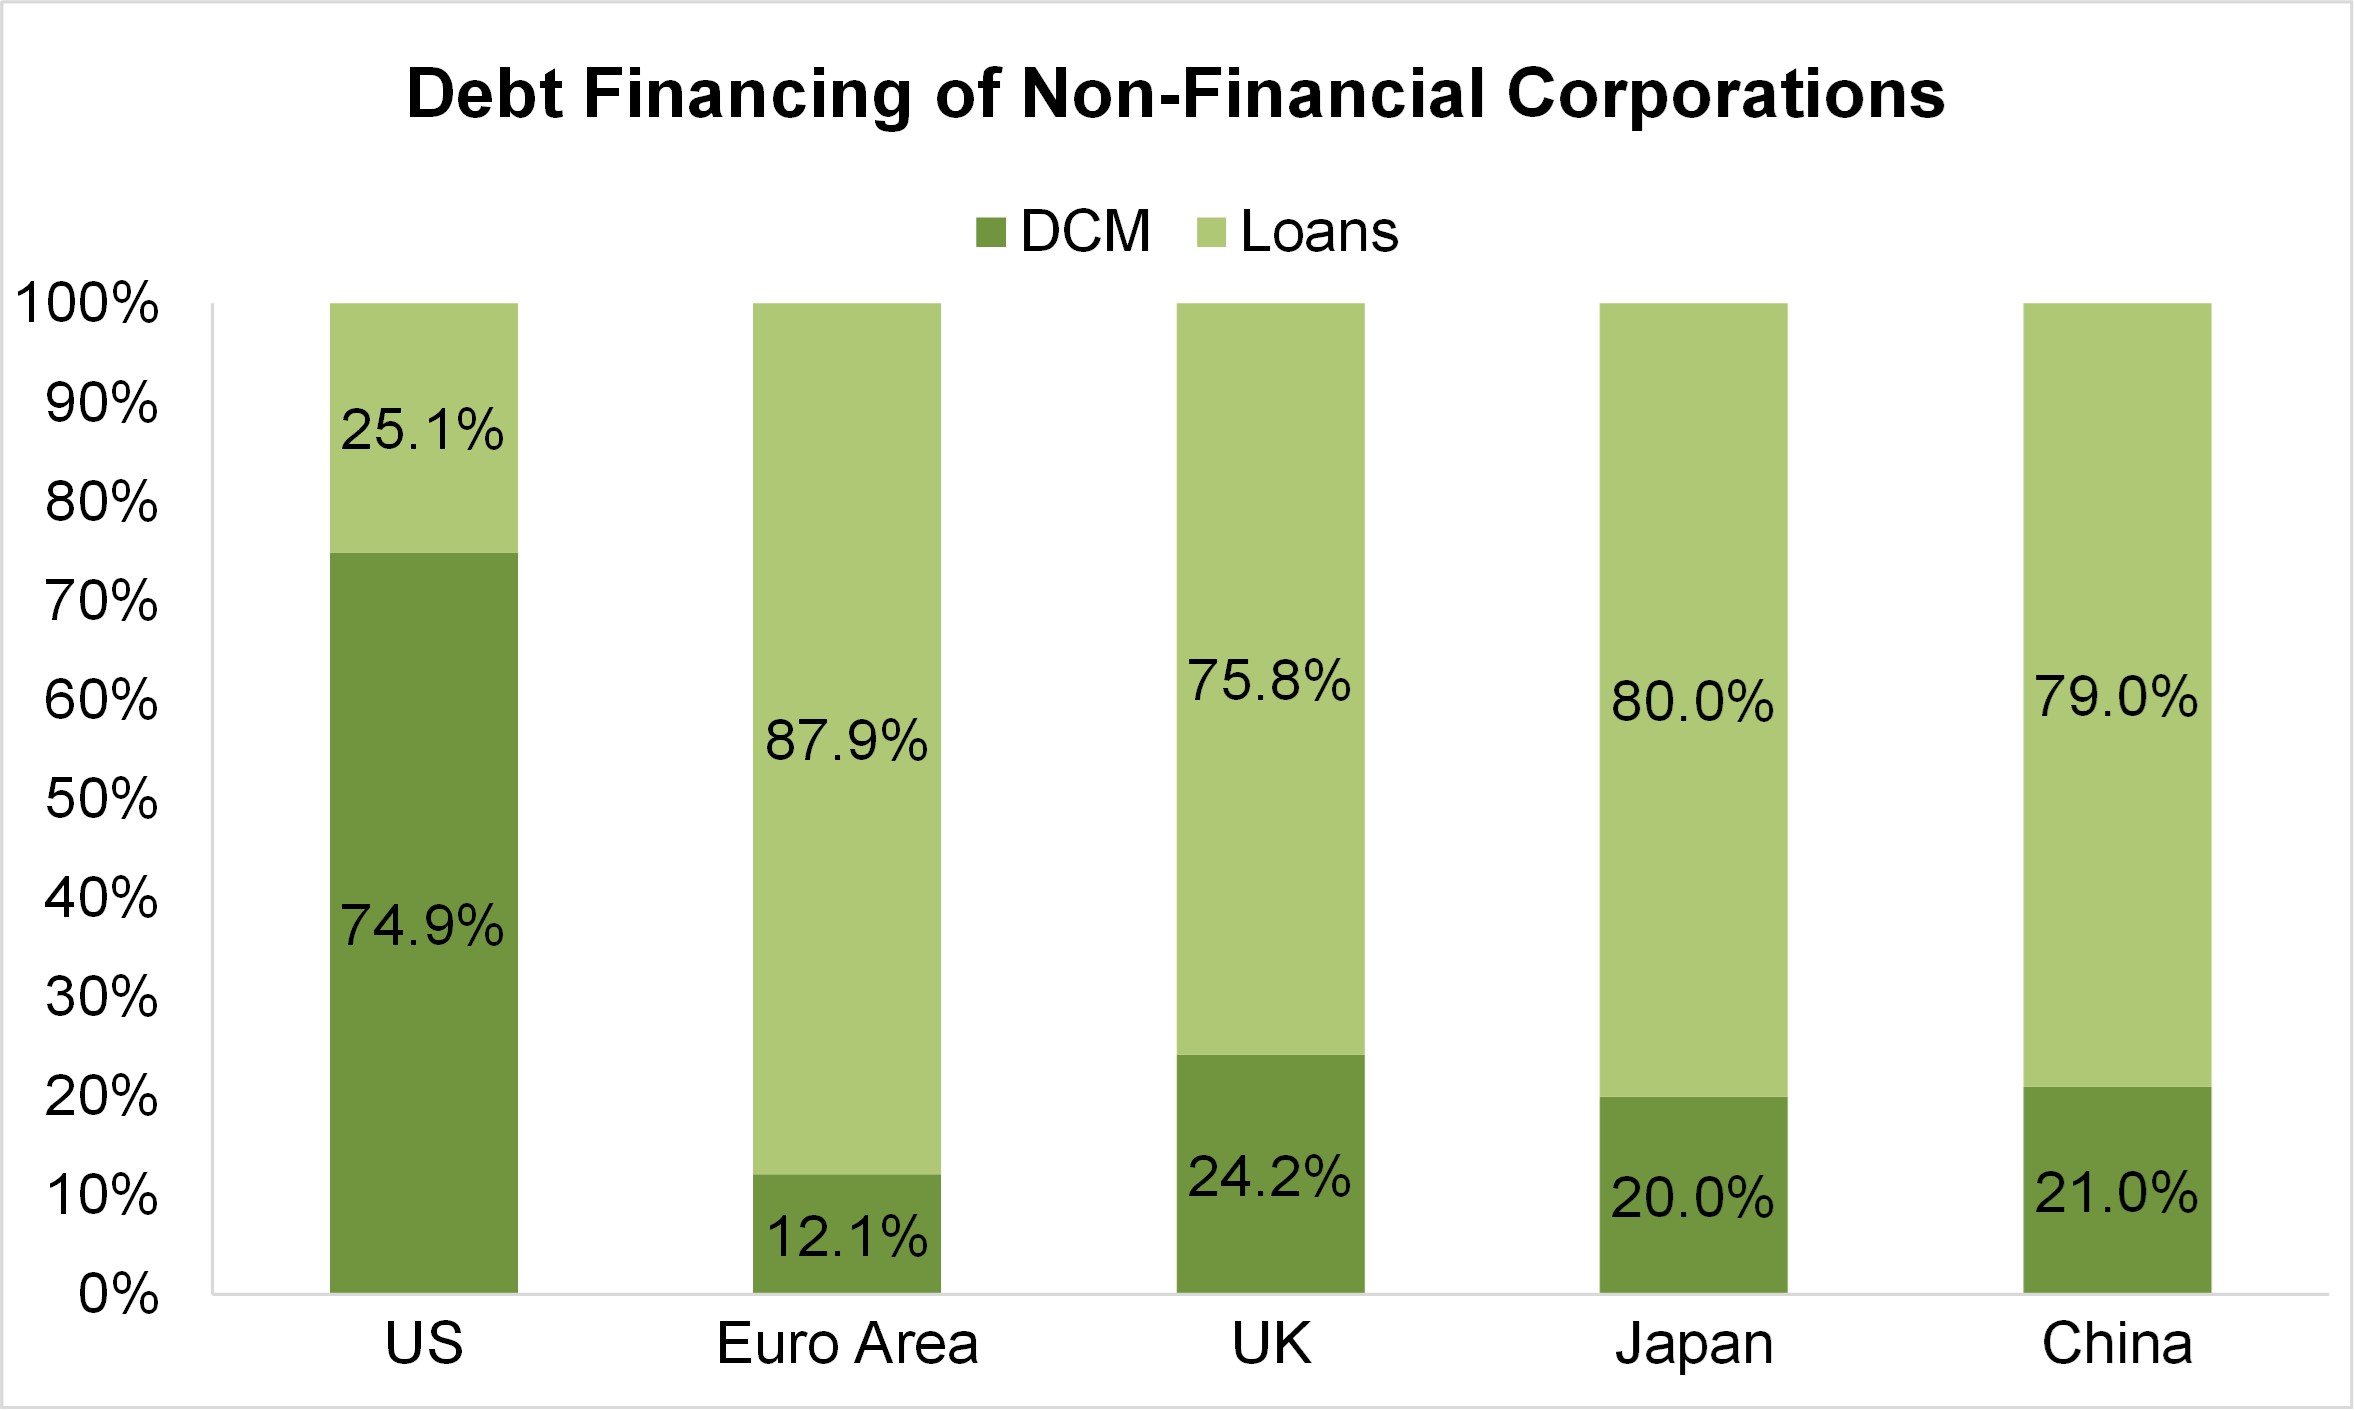
Source: OECD, Federal Reserve, ECB, Bank of Japan, National Bureau of Statistics of China, SIFMA estimates (2023, China 2021)
Note: Euro Area = 20 EU-member states using the Euro. Other financing, ex-China = insurance reserves, trade credits and trade advances; other financing, China = bankers’ acceptances, FDI, other foreign A/D, misc. and errors; DCM = debt capital markets, corporate bonds only, loans (US) = bank loans only
The U.S. capital markets are the largest in the world and continue to be among the deepest, most liquid, and most efficient. U.S. equity markets represent 42.6% of the $115.0 trillion in global equity market cap, or $49.0 trillion; this is 3.9x the next largest market, the EU. U.S. fixed income markets comprise 39.3% of the $140.7 trillion securities outstanding across the globe, or $55.3 trillion; this is 2.1x the next largest market, the EU.
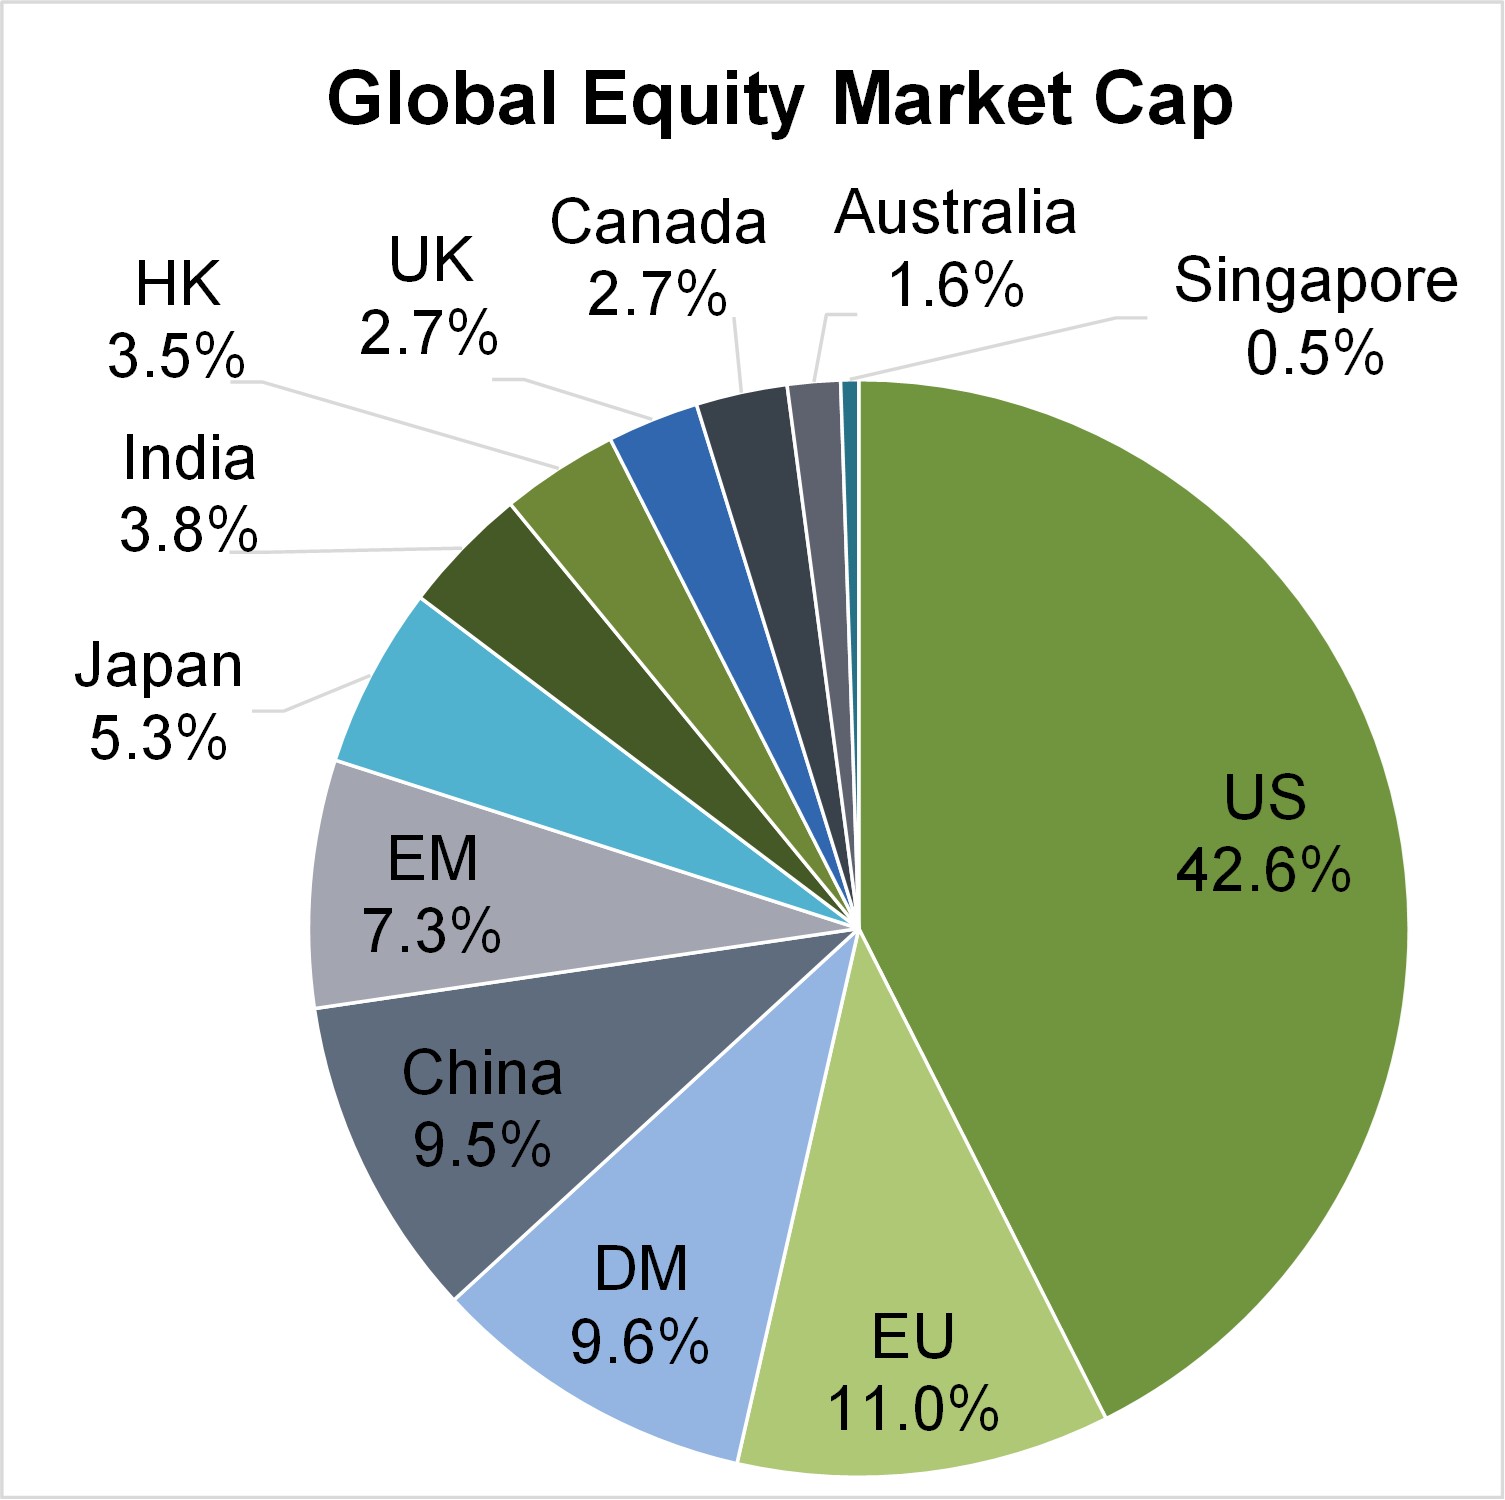
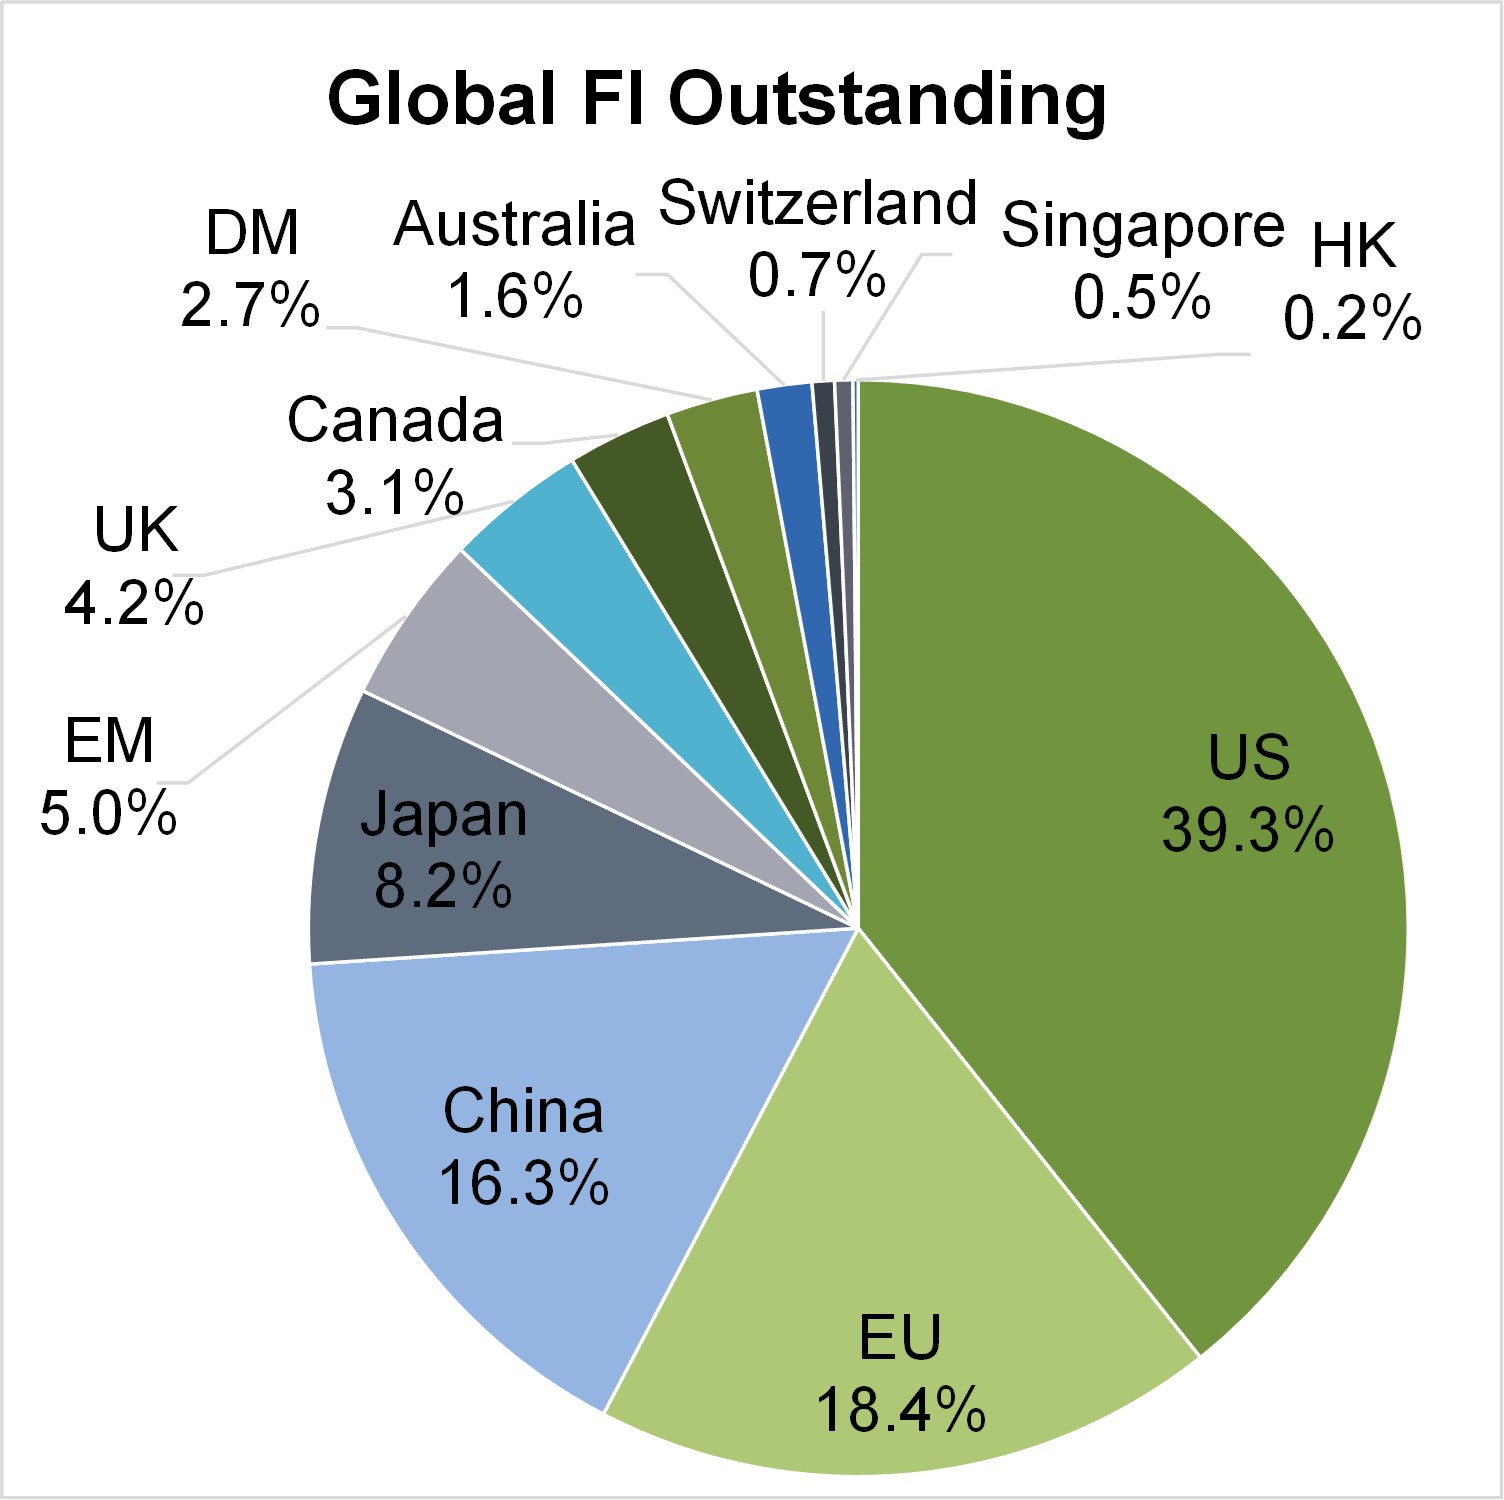
Source: Bank of International Settlements (BIS), World Federation of Exchanges, SIFMA estimates
Note: Market capitalization of listed domestic companies. DM = developed markets, EM = emerging markets, DM/EM exclude countries listed in the chart. HK = Hong Kong
We highlight the top ten takeaways for 2024 from our Capital Markets Fact Book:
Fixed Income Markets
1. Global fixed income markets outstanding increased 5.9% Y/Y to $140.7 trillion, while global long-term fixed income issuance decreased 0.1% to $25.2 trillion. U.S. fixed income markets comprised 39.3% of total outstanding, or $55.3 trillion.
2. U.S. long-term fixed income issuance declined 6.9% Y/Y to $8.3 trillion. U.S. Treasury securities issuance was $3.5 trillion, -8.1% Y/Y. Mortgage-backed securities (MBS) issuance decreased 38.9% Y/Y to $1.3 trillion, while municipal bond (munis) issuance decreased 1.6% Y/Y to $385.1 billion. Corporate bond issuance increased 5.6% Y/Y to $1.4 trillion.
Equity Markets
3. Global equity market capitalization increased 13.4% Y/Y to $115.0 trillion, as global equity issuance increased to $422.2 billion, +3.3% Y/Y. U.S. equity markets represented 42.6% of total market capitalization, or $49.0 trillion.
4. Total U.S. equity issuance (excluding SPACs) was $139.1 billion, +39.9% Y/Y. Initial public offering (IPO) deal value was $20.2 billion, +136.1% Y/Y. Secondary offerings, or follow-ons, totaled $107.1 billion, +36.4% Y/Y.
5. U.S. stock markets – in terms of average index prices – continued to rise, closing the year at: S&P 500 4,769.83, +24.2% Y/Y; Nasdaq Composite 15,011.35, +43.4% Y/Y; Dow Jones Industrial Average (DJIA) 37,689.54, +13.7% Y/Y; and Russell 2000 2,027.07, +15.1% Y/Y.
The Individual Investor
6. According to the latest Federal Reserve survey (2022), 58.0% of U.S. households own equities, +5.3 pps from the prior survey (2019).
7. U.S. households’ liquid financial assets increased 13.3% Y/Y to $66.4 trillion. The breakout of liquid financial assets held by U.S. households was: equities 47.6%; mutual funds 16.5%; bonds 8.6%; money market funds 6.0%; and deposits 21.3%.
8. U.S. retirement assets increased 9.0% Y/Y to $44.8 trillion. The breakout of total U.S. retirement assets was: IRAs 30.3%; private pensions 28.9%; annuities 9.3%; government pension assets 31.5%.
The Securities Industry
9. National securities industry employment reached 1,120,000 jobs in 2023, +3.1% Y/Y. The number of registered representatives increased 1.2% to 628,392.
10. The number of FINRA registered broker-dealers decreased 2.4% Y/Y to 3,298 in 2023. The number of branch offices declined 1.3% to 148,718, while the number of investment advisor firms decreased 0.3% to 32,402.
Author

Katie Kolchin, CFA is Managing Director, Head of Research for SIFMA. An experienced research analyst with extensive global capital markets industry knowledge, she leads the research team’s economics and statistics work and is the author of SIFMA Insights.