The VIX’s Wild Ride
SIFMA Insights Spotlight: A Comparison of Today’s Volatility vs. Historical Levels
The emergence of the global pandemic Covid-19 in the first quarter of 2020 caused severe economic and capital markets shocks. This turmoil is evidenced by sharp price declines – yet spikes in volumes – in equities markets, which closed the first quarter with their worst performance since the financial crisis. Additionally, volatility, as measured by the CBOE Volatility Index (VIX1), elevated to historic highs. While people point out that the VIX has started to come down, it remains elevated and ticked back up this week with oil markets concerns. We are not out of the woods yet.
In this report, we look at levels of the VIX during the Covid-19 crisis, compared to the global financial crisis and historical levels.
1 A real-time market index that represents the market’s expectation of 30-day forward looking volatility, as derived from the price inputs of S&P 500 index options. It measures market risk and investor sentiment (fear, stress) and is often called the fear index
Where Are We Now?
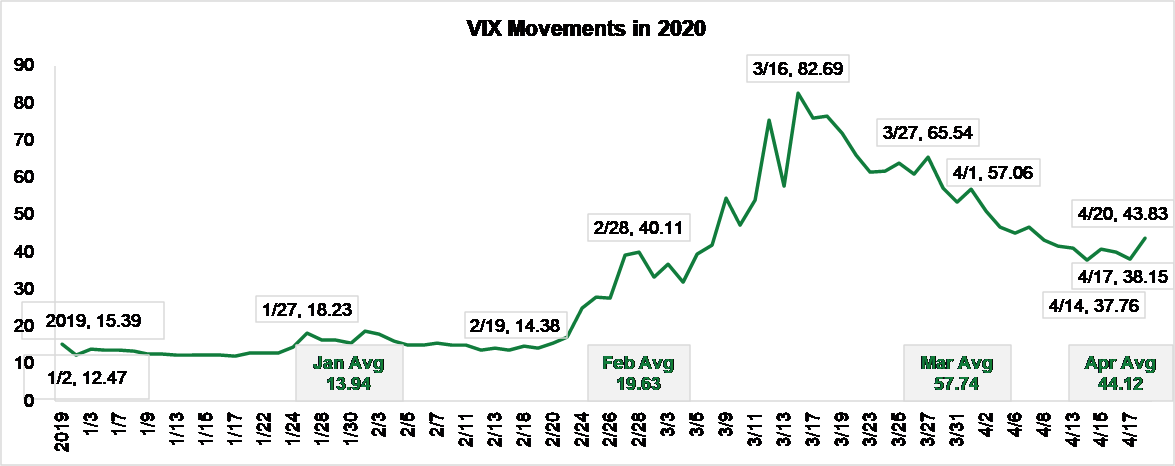
We started the year in a benign environment, with the VIX at 12.47 on January 2 and a January average of 13.94, both below 2019 average levels (15.39). Volatility started increasing in February, with an average of 19.63 and peak of 39.16. The VIX then spiked in March, with an average of 57.74 and a peak of 82.69. The April average is down to 44.12, with a peak of 57.06. What is interesting is that we thought the VIX was on a downward trend, with levels dropping below 40.00 at the end of last week. Yet, we ticked back up this week, with the significant decline in the crude oil futures contract (actually pricing negatively), as oil demand cratered under this Covid-19 related stay at home environment. As we continue to uncover new macroeconomic dislocations, we can expect additional volatility spikes.
 Source: Bloomberg, SIFMA estimates
VIX During Covid-19 vs. the Global Financial Crisis
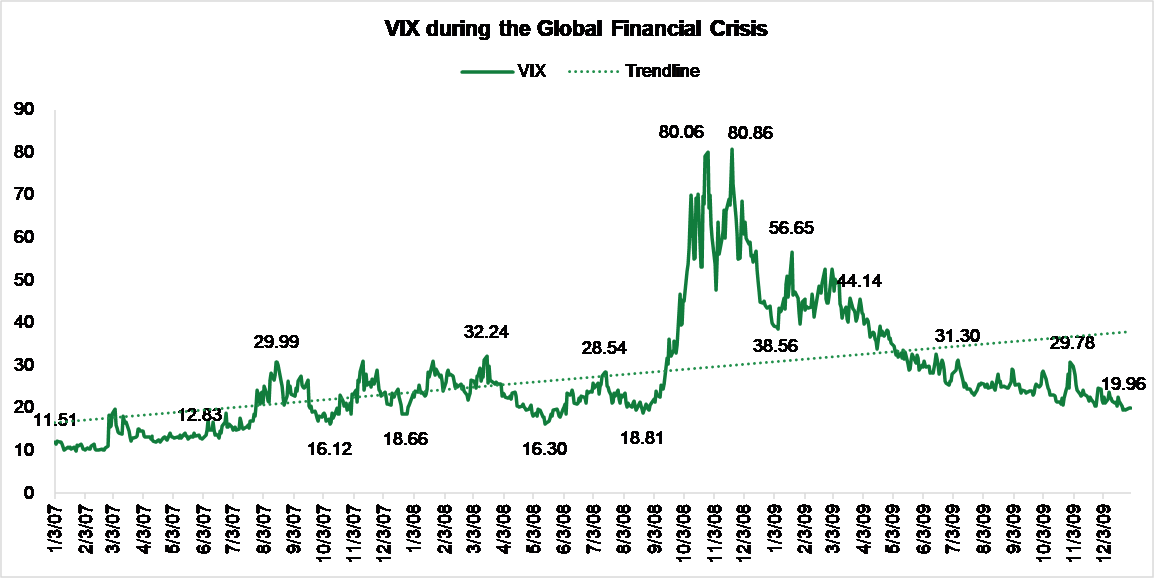
In this section, we compare today’s volatility to that of the global financial crisis, noting the two crises are very different in causes and recovery processes. In the first chart, we show the volatility pattern in 2019, compared to the movements caused by Covid-19 in 2020. In the second chart, we compare VIX movements in 2007, 2008 and 2009.
- Covid-19 Crisis: Average VIX 33.46, 2.2x the average for 2019; the peak to trough (peak price minus trough price) was 70.59, 5.1x the spread in 2019
- Global Financial Crisis (GFC):
- 2007 average VIX 17.54; peak to trough 21.20
- 2008 (worst year statistically) average VIX 32.69, 1.9x 2007; peak to trough of 64.56, 3.0x 2007
- 2009 average VIX 31.52, ~1.0x 2008; peak to trough 37.18, 0.6x 2008
- Covid-19 has a slightly higher peak than 2008, 82.69 vs. 80.86 (1.02x); it also has a higher peak to trough spread, 70.59 vs. 64.56 for 2008 (Covid-19 1.09x 2008)
- Looking at it another way, using the 2008 peak of 80.86 minus the trough in 2007 of 9.89, the spread is 70.97; this is slightly higher than the 70.59 Covid-19 spread (mixed years GFC 1.01x Covid-19)
- Summary: Covid-19 slightly worse than GFC as it is beating or matching stats in a much shorter time frame
VIX during the Covid-19 Crisis
| 2019 | VIX | 2020 | VIX | 20/19 |
| Jan 2 | 23.22 | Jan 2 | 12.47 | 0.5x |
| Dec 31 | 13.78 | Apr 20 | 43.83 | 3.2x |
| Peak | 25.45 | Peak | 82.69 | 3.2x |
| Trough | 11.54 | Trough | 12.10 | 1.0x |
| Average | 15.39 | Average | 33.46 | 2.2x |
| Peak to Trough | 13.91 | Peak to Trough | 70.59 | 5.1x |
| D31/J2 | -41% | A20/J2 | 251% | |
| Peak/J2 | -10% | Peak/J2 | 563% | |
| Avg/J2 | -34% | Avg/J2 | 168% |
VIX during the Global Financial Crisis
| 2007 | VIX | 2008 | VIX | 08/07 | 2009 | VIX | 09/08 |
| Jan 3 | 12.04 | Jan 2 | 23.17 | 1.9x | Jan 2 | 39.19 | 1.7x |
| Dec 31 | 22.50 | Dec 31 | 40.00 | 3.2x | Dec 30 | 19.96 | 0.5x |
| Peak | 31.09 | Peak | 80.86 | 3.2x | Peak | 56.65 | 0.7x |
| Trough | 9.89 | Trough | 16.30 | 1.0x | Trough | 19.47 | 1.2x |
| Average | 17.54 | Average | 32.69 | 2.2x | Average | 31.52 | 1.0x |
| Peak to Trough | 21.20 | Peak to Trough | 64.56 | 3.0x | Peak to Trough | 37.18 | 0.6x |
| D31/J3 | 87% | D31/J2 | 73% | D30/J2 | D30/J2 | -49% | |
| Peak/J3 | 158% | Peak/J2 | 249% | Peak/J2 | Peak/J2 | 45% | |
| Avg/J3 | 46% | Avg/J2 | 41% | Avg/J2 | Avg/J2 | -20% |
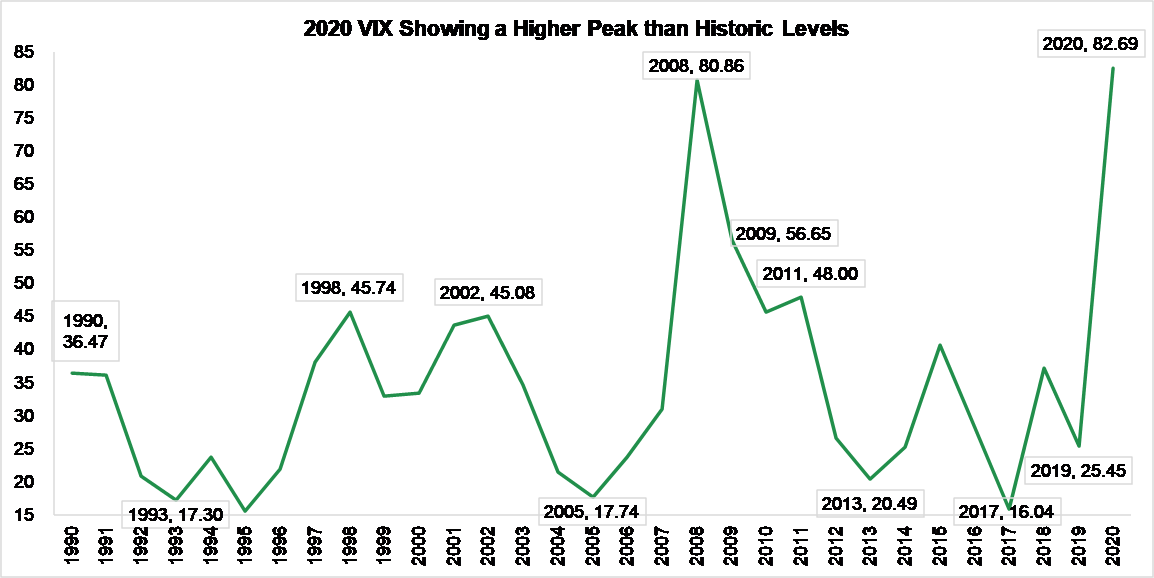
VIX During Covid-19 vs. Historical Levels
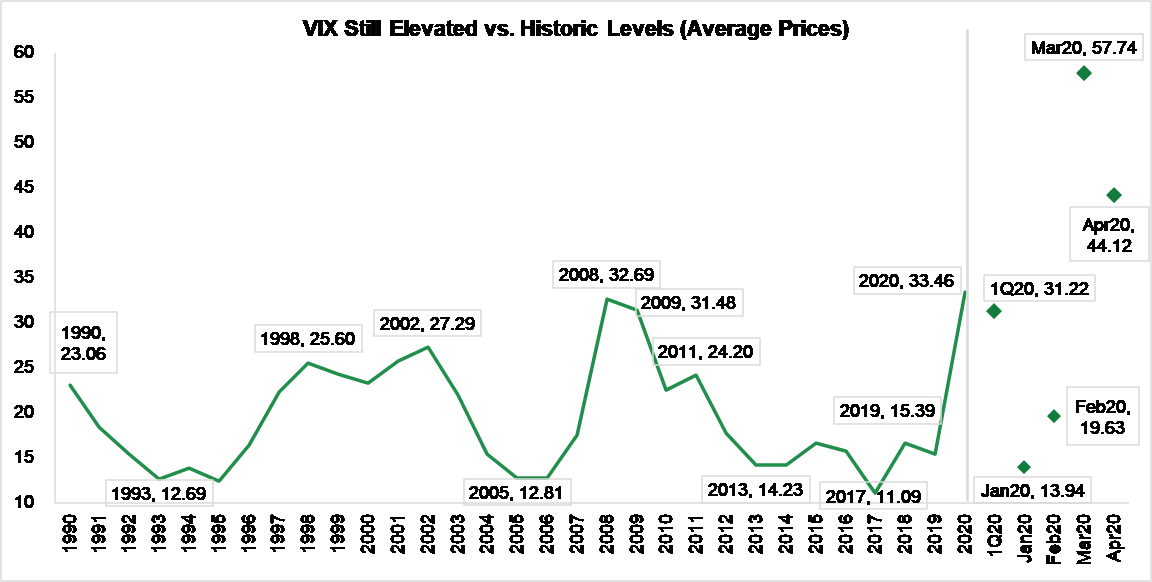
Looking back to 1990, the average VIX for 2020 (through April 20) is 33.46. This is higher than any other period of heightened volatility, even edging out the Global Financial Crisis (GFC): 2020 VIX 1.45x 1990, 1.31x 1998 and 1.02x the GFC. The even higher March 2020 average VIX of 57.74, is 2.50x 1990, 2.26x 1998 and 1.77x 2008.
Looking at the statistics for averages and peaks, it is clear Covid-19 is worse than any other time period in the 1990s or early 2000s. However, one could make the argument that the Covid-19 crisis is in line with, not significantly worse than, the GFC. We point out that the GCF, and its corresponding stats, were for a much longer time period and took a longer time to bubble over and reach peak VIX than Covid-19. A slight edge goes to Covid-19.
- 1990 (VIX 23.06) = The U.S. was in a recession
- 1998 (VIX 25.60) = The 1997 Asian Financial Crisis and 1998 Russian Ruble Crisis culminated in the collapse of hedge fund Long Term Capital Management (eventually bailed out by a consortium of banks)
- 2002 (VIX 27.29) = The scandals at WorldCom & Enron combined with the bursting of the Dot-Com Bubble
- 2008 (VIX 32.69) = GFC = VIX at historical norms heading into 2007, moved into the 20s by mid-July; moved into levels in the 30s through September 2008, until bubbling over in October 2008
- 2020 YTD (VIX 33.46, through April 20) = Covid-19 = historical VIX norms in January, moving into the 20s in February, until bubbling over in March and remaining elevated in April
 Source: Bloomberg
Looking at peak VIX for the years dating back to 1990, 2020 (through April 20) was 82.69, higher than any other period of heightened volatility including the GFC: 2020 peak VIX 2.27x 1990, 1.81x 1998 and 1.02x the GFC.
- 1990 peak VIX47
- 1998 peak VIX 45.74
- 2002 peak VIX 45.08
- 2008 peak VIX 80.86
- 2020 YTD (through April 20) peak VIX 82.69
 Source: Bloomberg
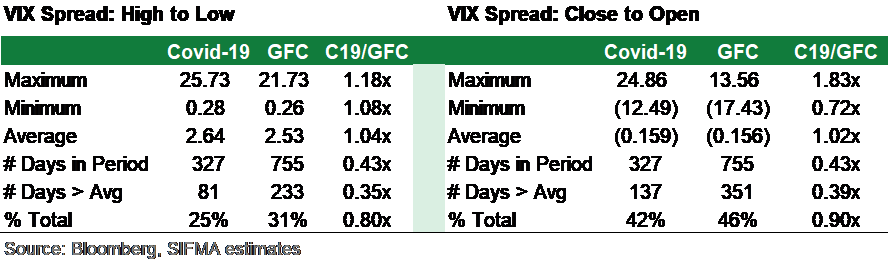
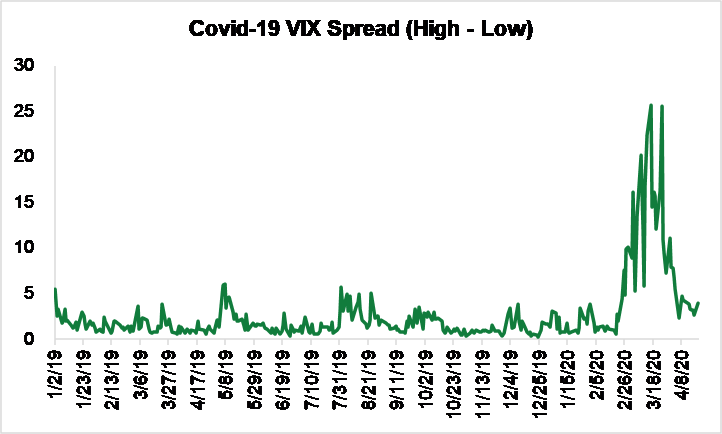
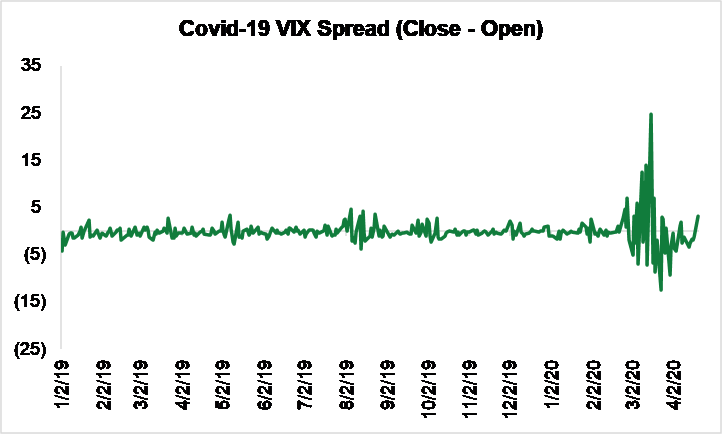
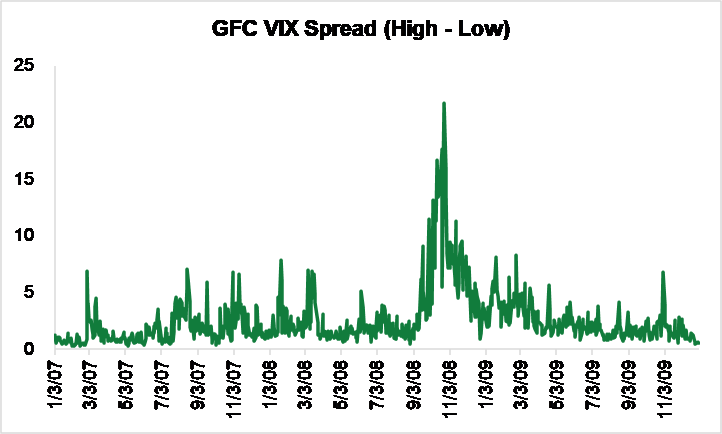
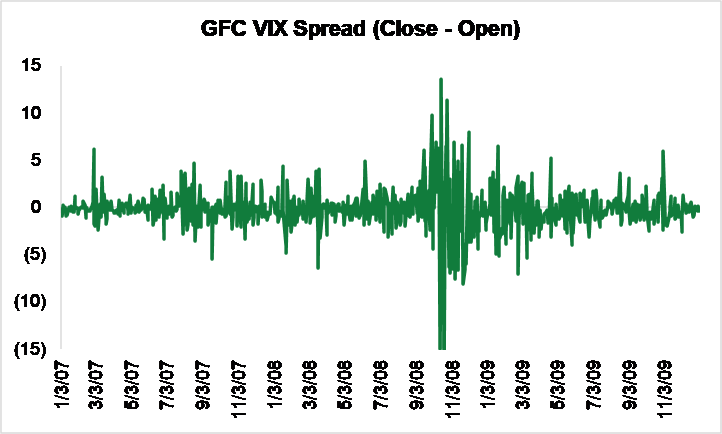
Intraday Spreads
Finally, we look at spreads, or intraday movements form both the high minus low and open minus close prices:
- Covid-19 is a shorter time period than GFC (for now), 0.43x days; as such, it shows less days above average in both high-low and close-open
- High to low: Covid-19 spread seeing a higher peak, minimum and average
- Close to open: Covid-19 spread seeing a higher peak, a lower minimum and slightly higher average
- Covid-19 high-low spreads slightly more exaggerated; GCF close-open more overstated to the downside
 Source: Bloomberg
 Source: Bloomberg
 Source: Bloomberg
 Source: Bloomberg
Author
Katie Kolchin, CFA
Director of Research
SIFMA Insights